
What’s on the page
Compliance banner
A green or red banner answers the headline question: are you compliant for the selected year? It shows fleet GHG intensity, the year’s target, and the gap.Summary cards
- Fleet GHG Intensity (gCO₂eq/MJ)
- Year target + reduction percentage
- Compliance Gap — actual minus target
- Vessels Reporting — count
- Total Energy (MJ, formatted in TJ/GJ)
- Total Emissions (tonnes CO₂eq)
- Compliance Balance — surplus or deficit, in tonnes CO₂eq
- Potential Penalty (€) — calculated only if non-compliant
Daily intensity chart

Fuel breakdown

| Column | Meaning |
|---|---|
| Fuel Type | HFO, MGO, LNG, Bio-Blend, etc. |
| Consumption (T) | Tonnes burned |
| Energy (MJ) | Tonnes × LCV |
| WtT | Well-to-Tank intensity (gCO₂eq/MJ) |
| TtW | Tank-to-Wake intensity (gCO₂eq/MJ) |
| WtW | Total = WtT + TtW |
| Share % | % of total fleet energy |
Per-vessel ranking
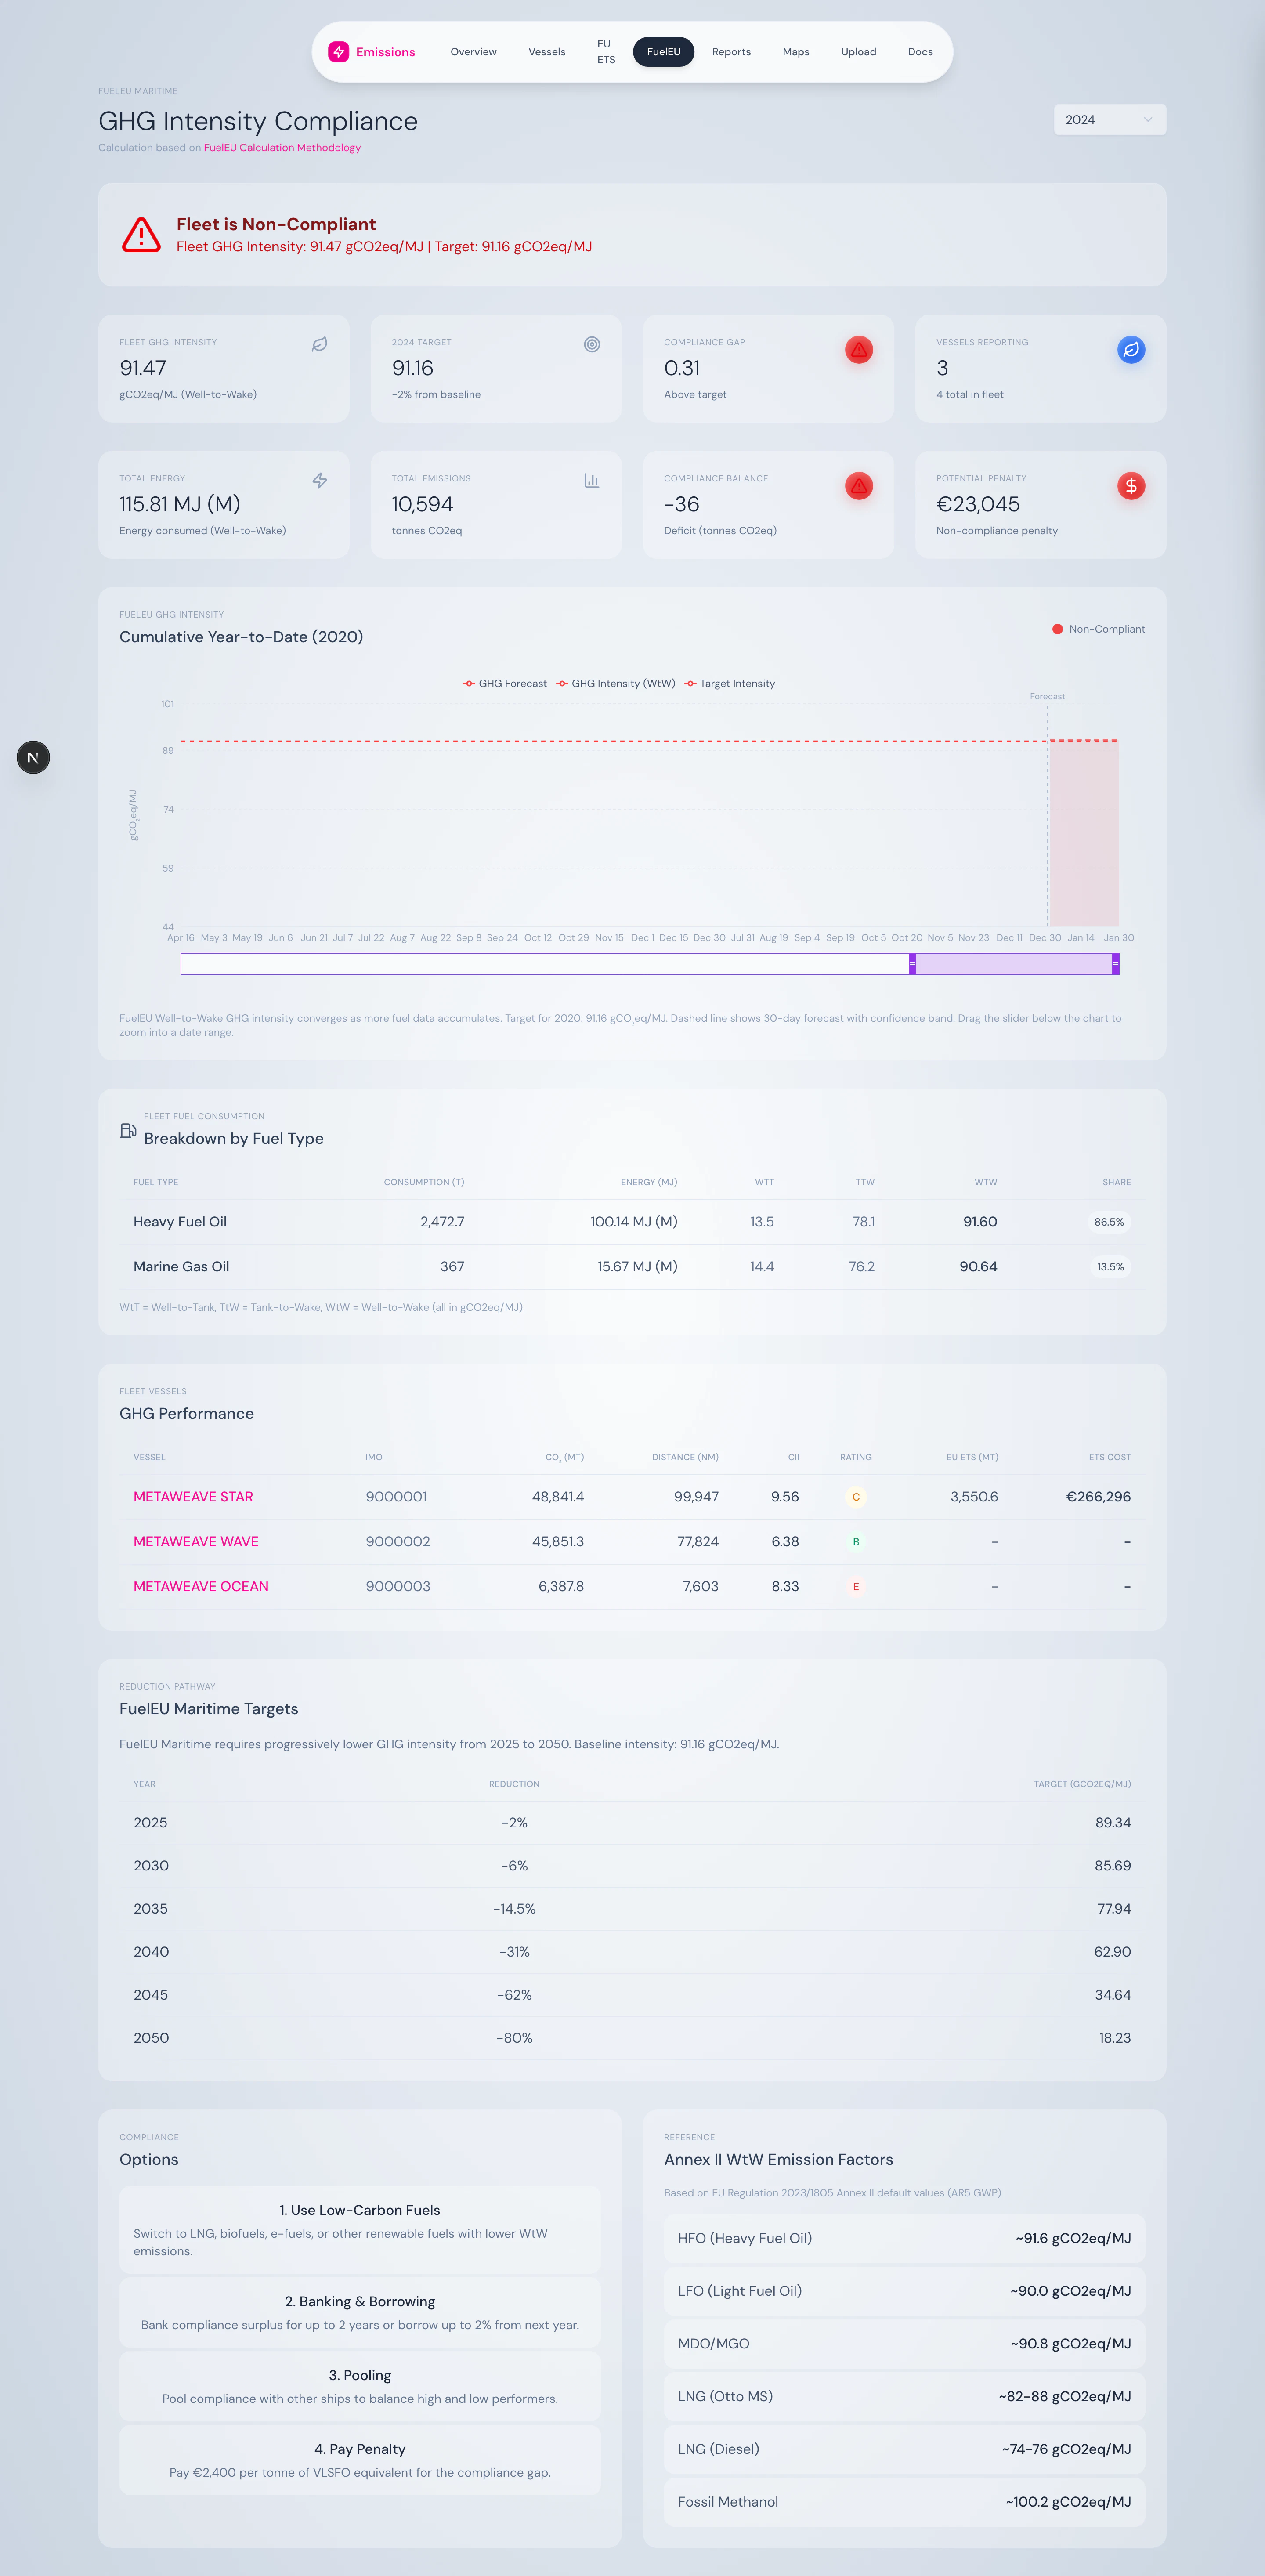
Reduction pathway reference

Annex II factors reference
A second static reference table lists default WtT, TtW, and WtW values for every supported fuel — what the platform uses when no measured value is provided.What you can do here
- Track GHG intensity day-by-day across the year
- Identify which vessels and which fuels are dragging compliance down
- Model penalty exposure at current consumption levels
- Plan fleet transitions against the 2030 / 2035 / 2040 targets
- Generate the FuelEU Maritime Report for verifier submission
Source
Logic insrc/lib/utils/fuelEUCalculator.ts. Hydrated from FleetService.getFleetSummary().