Pick a year
The year selector in the header drives every page in the app. Choose any year that has data — or stay on the current year and toggle YTD for year-to-date.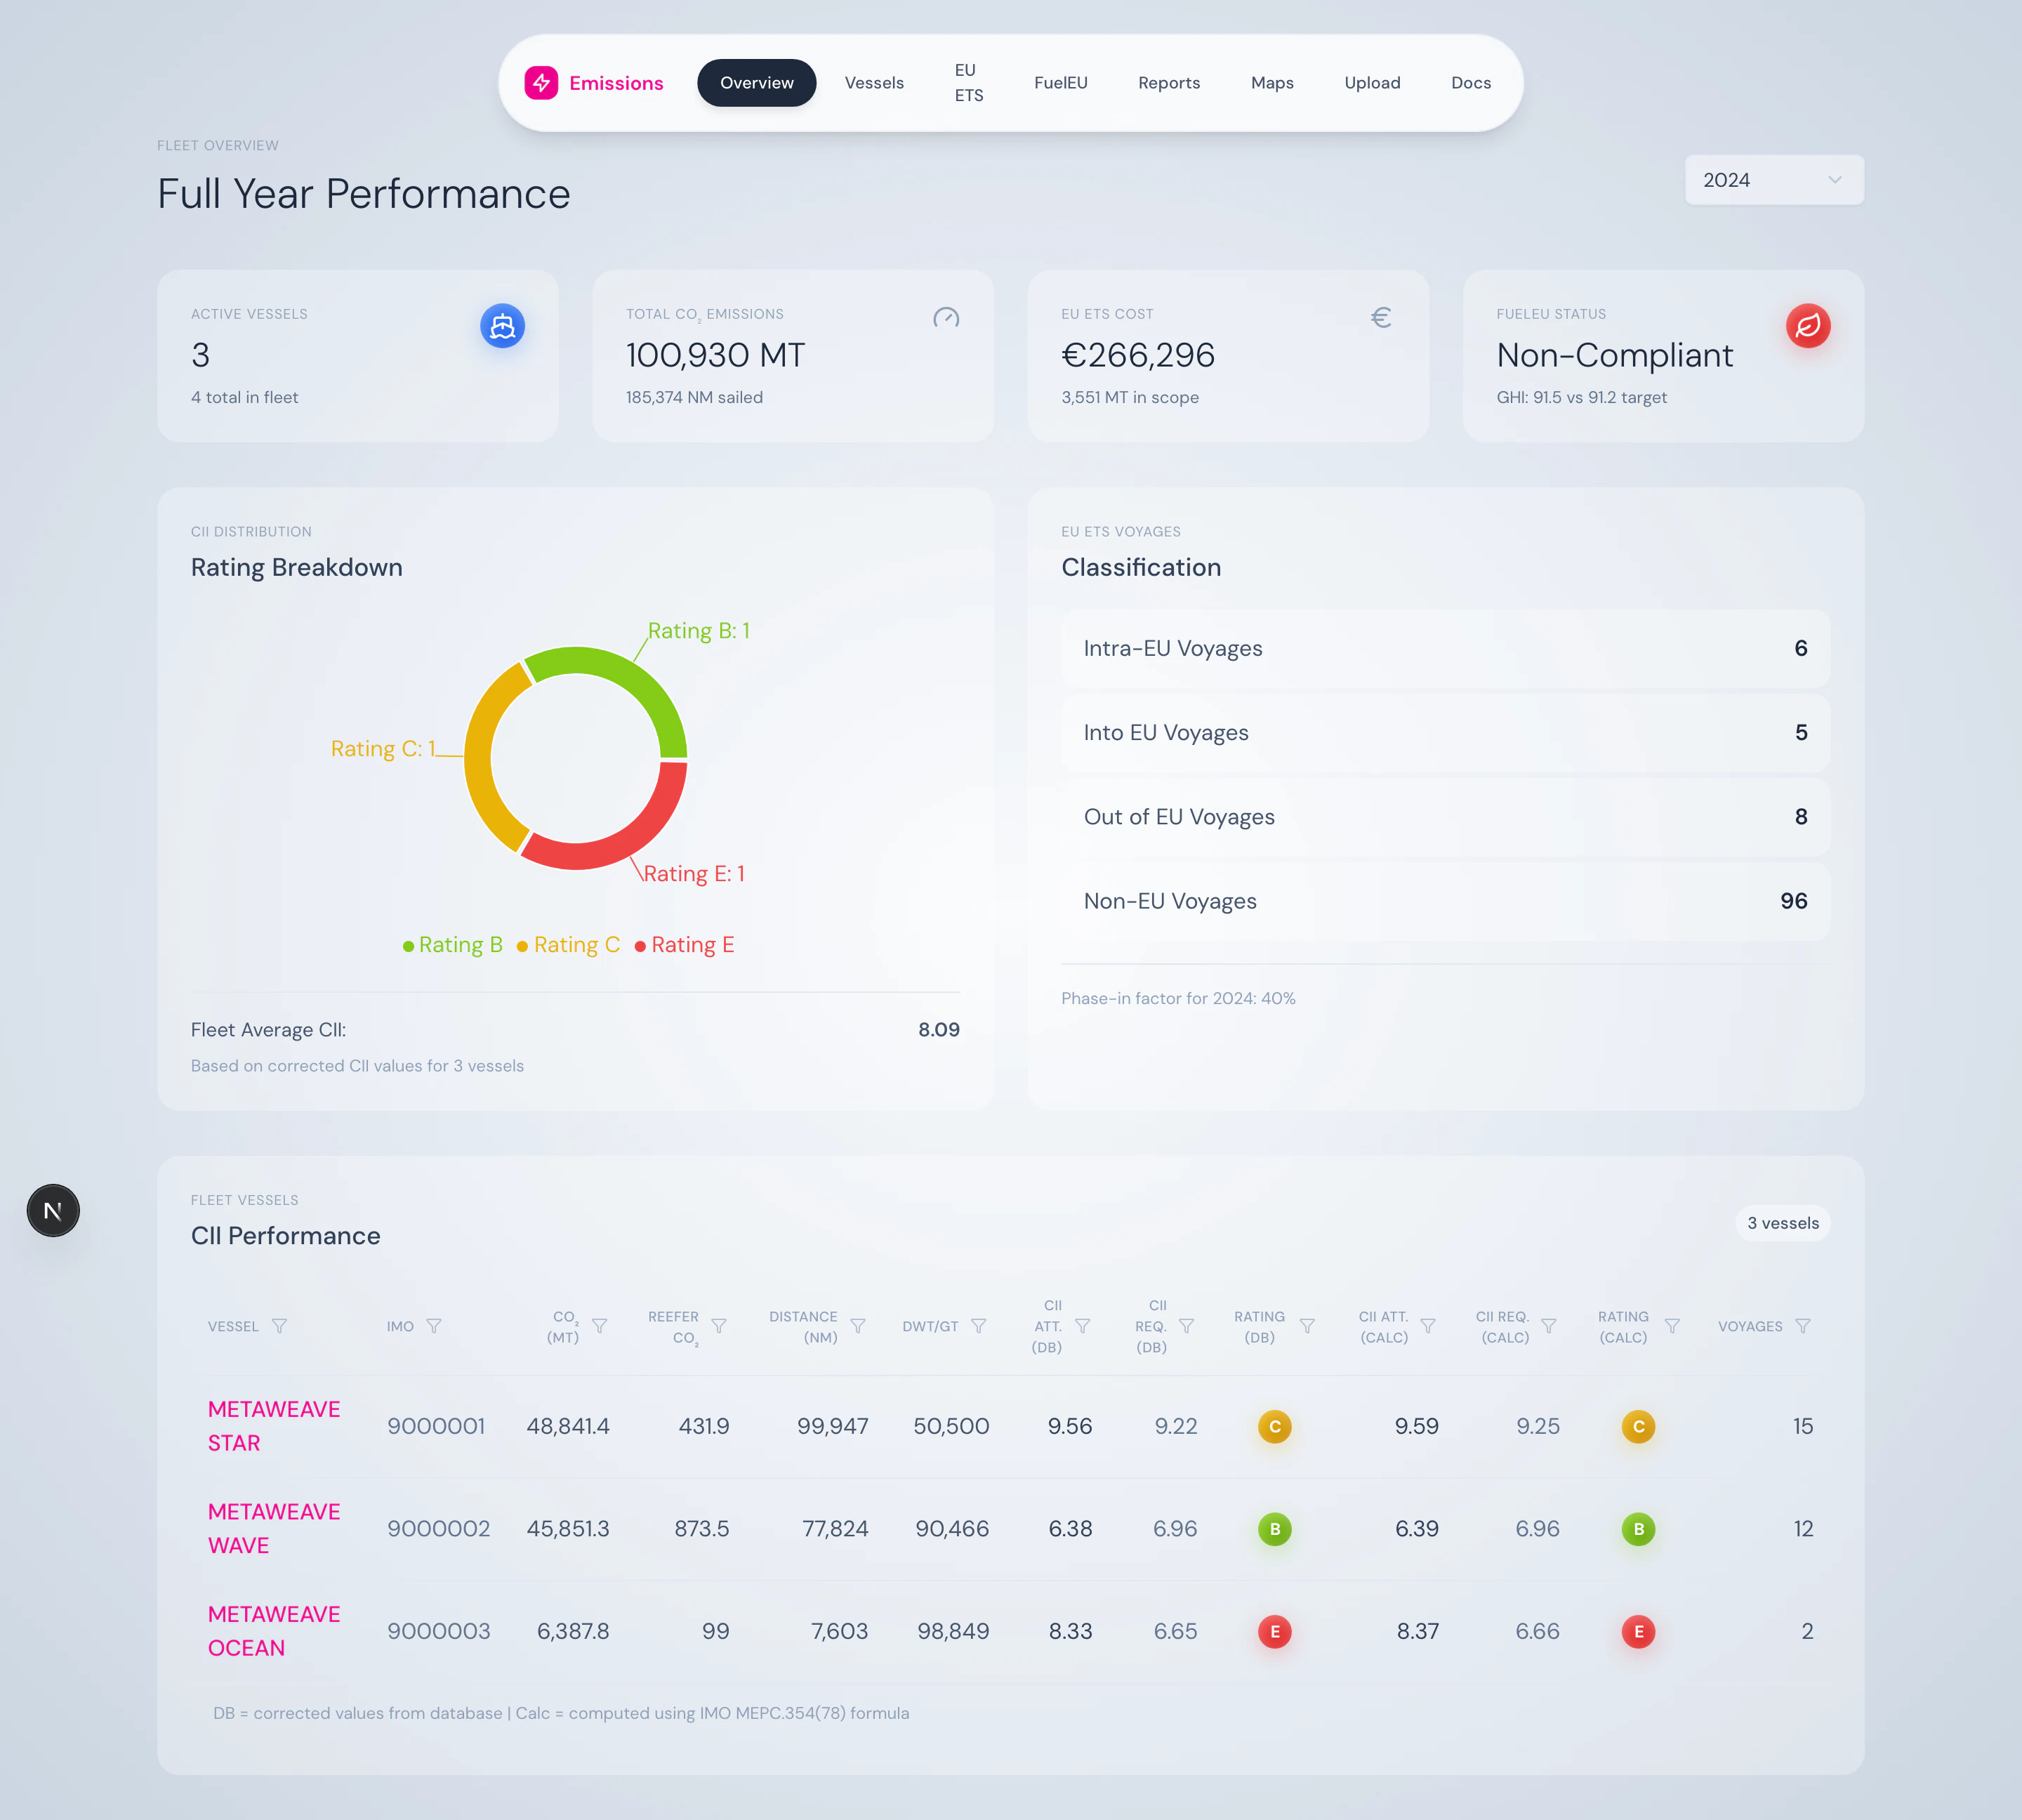
Read the fleet at a glance
The home page tells you four things instantly: how many vessels reported, total CO₂, EU ETS cost so far, and FuelEU compliance status — plus the A–E distribution across the fleet.
Drill into a vessel
Click any row in the fleet table. The vessel page shows a CII gauge, EEOI by TEU and by weight, fuel breakdown, and a 12-month rolling chart with required CII step lines.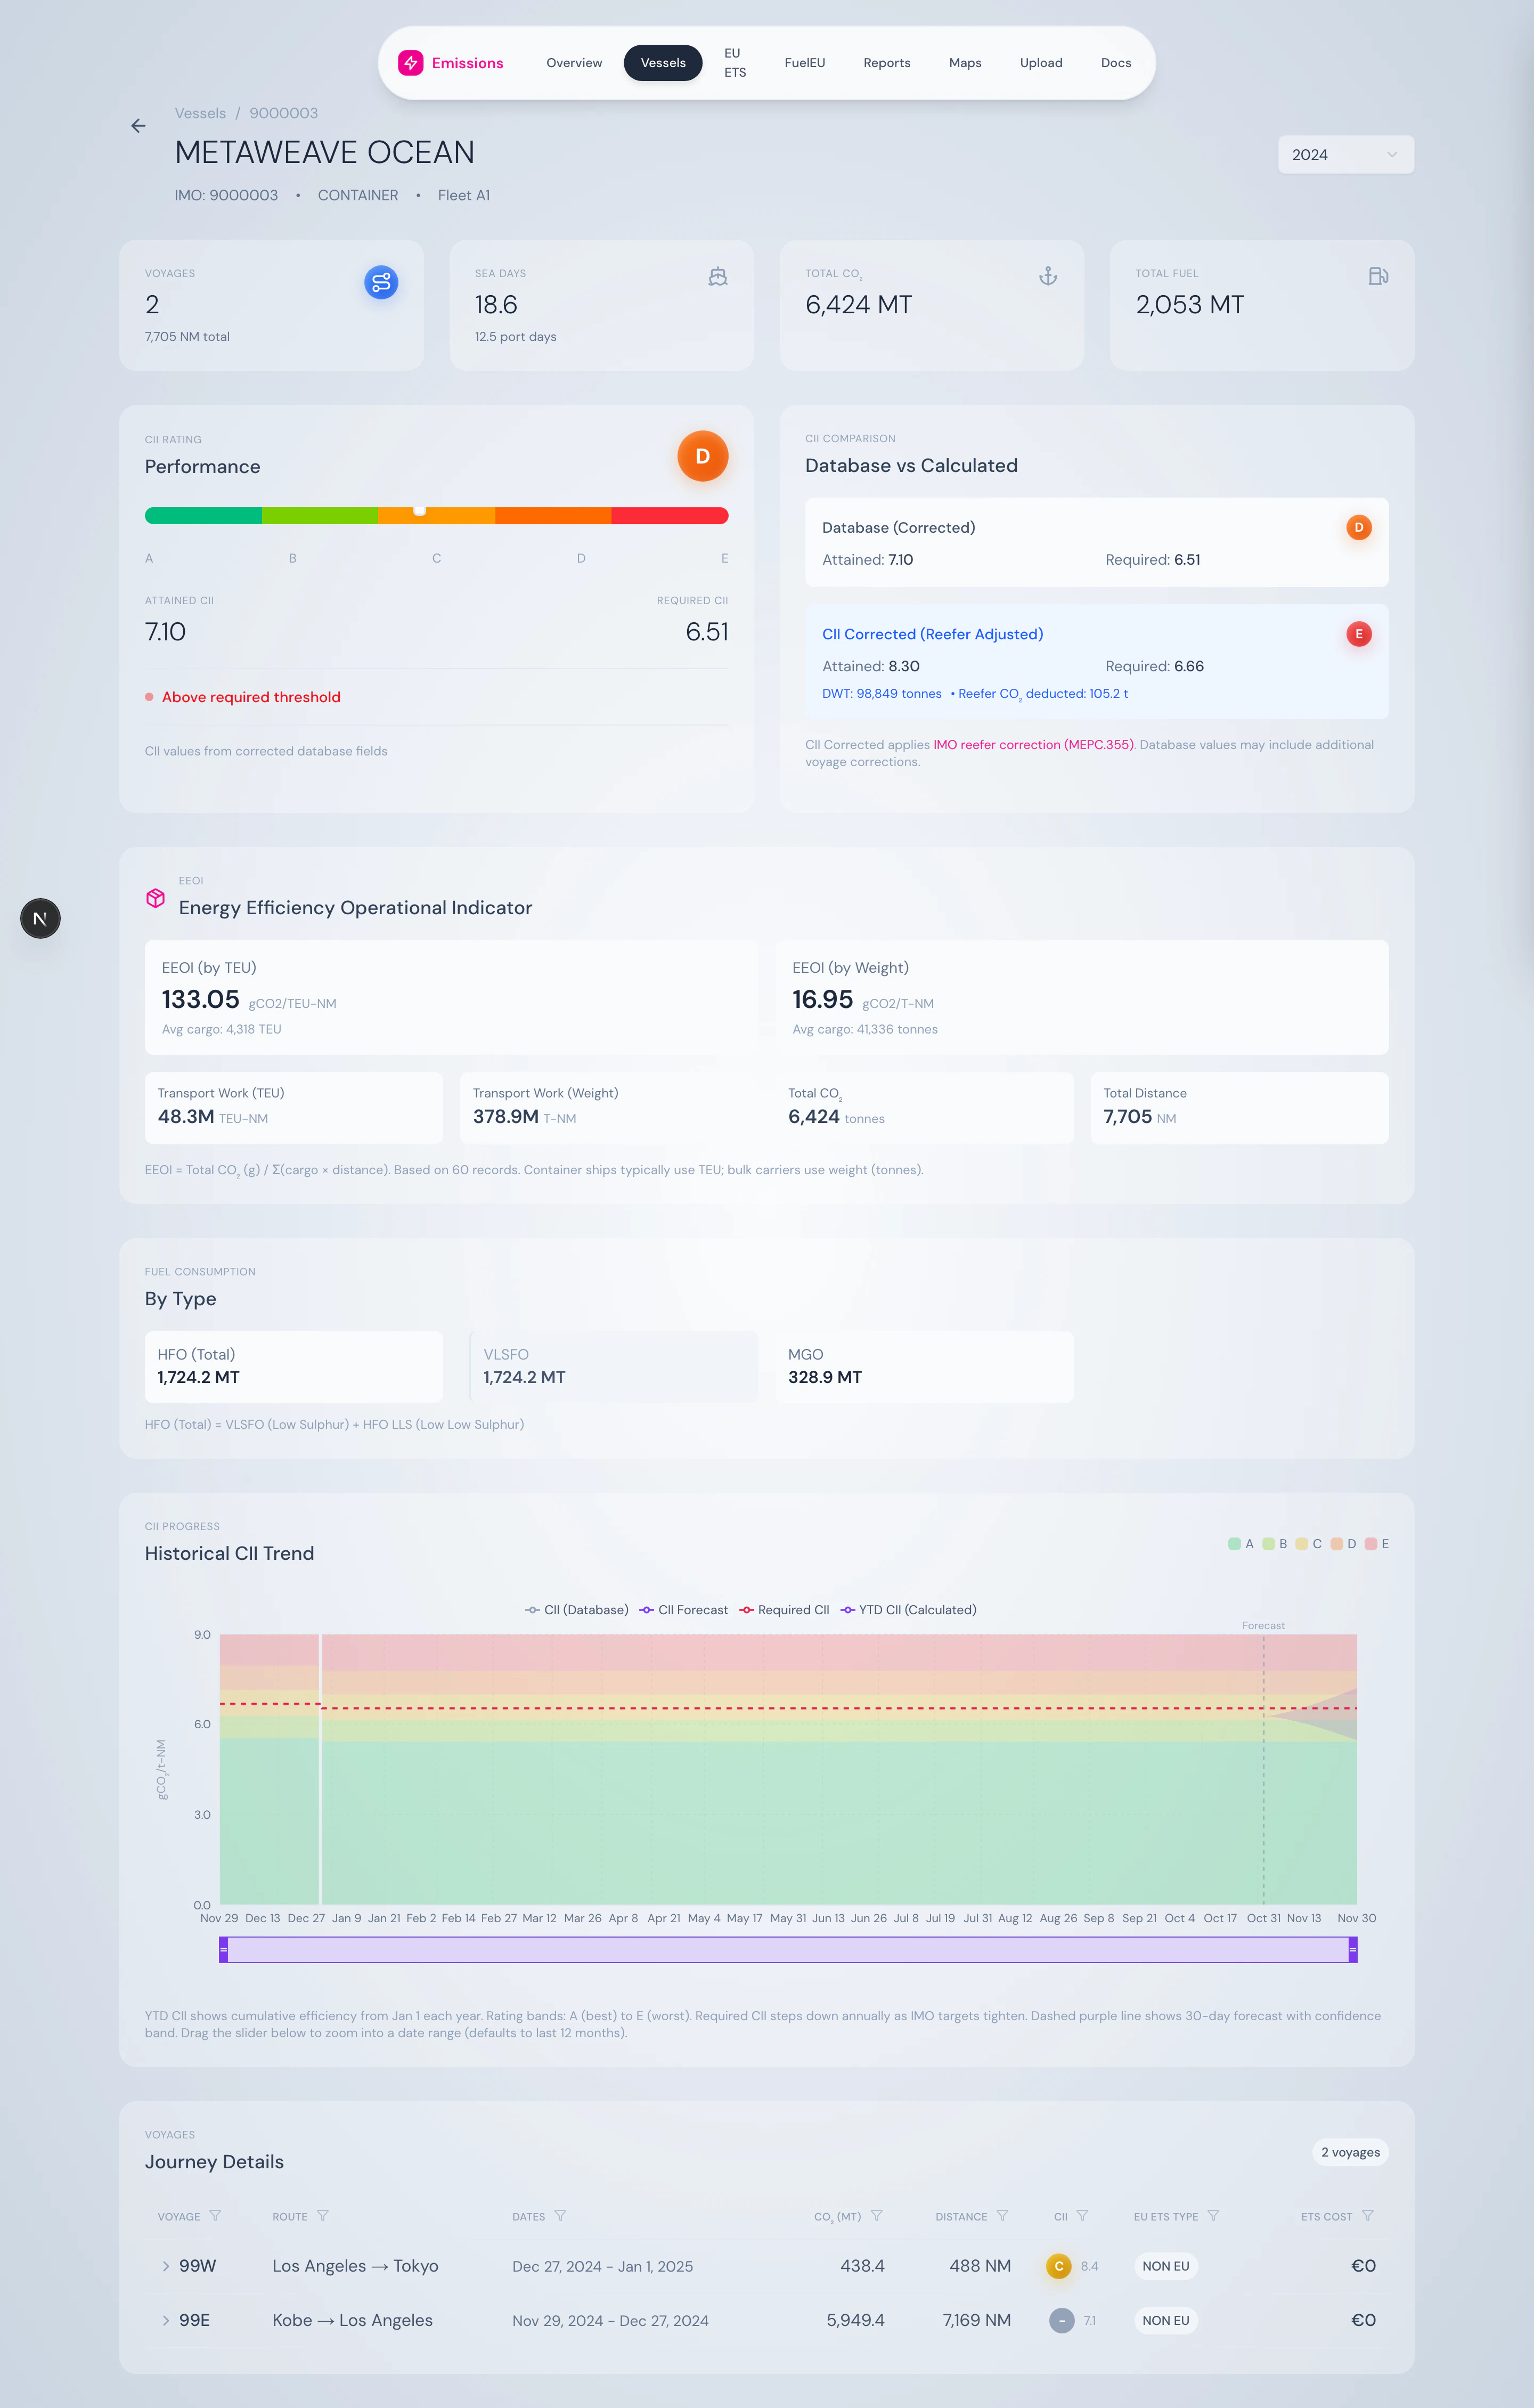
Expand a voyage
The voyages table on the vessel page is expandable. Click a row to see the leg-by-leg breakdown with EU ETS coverage applied to each segment.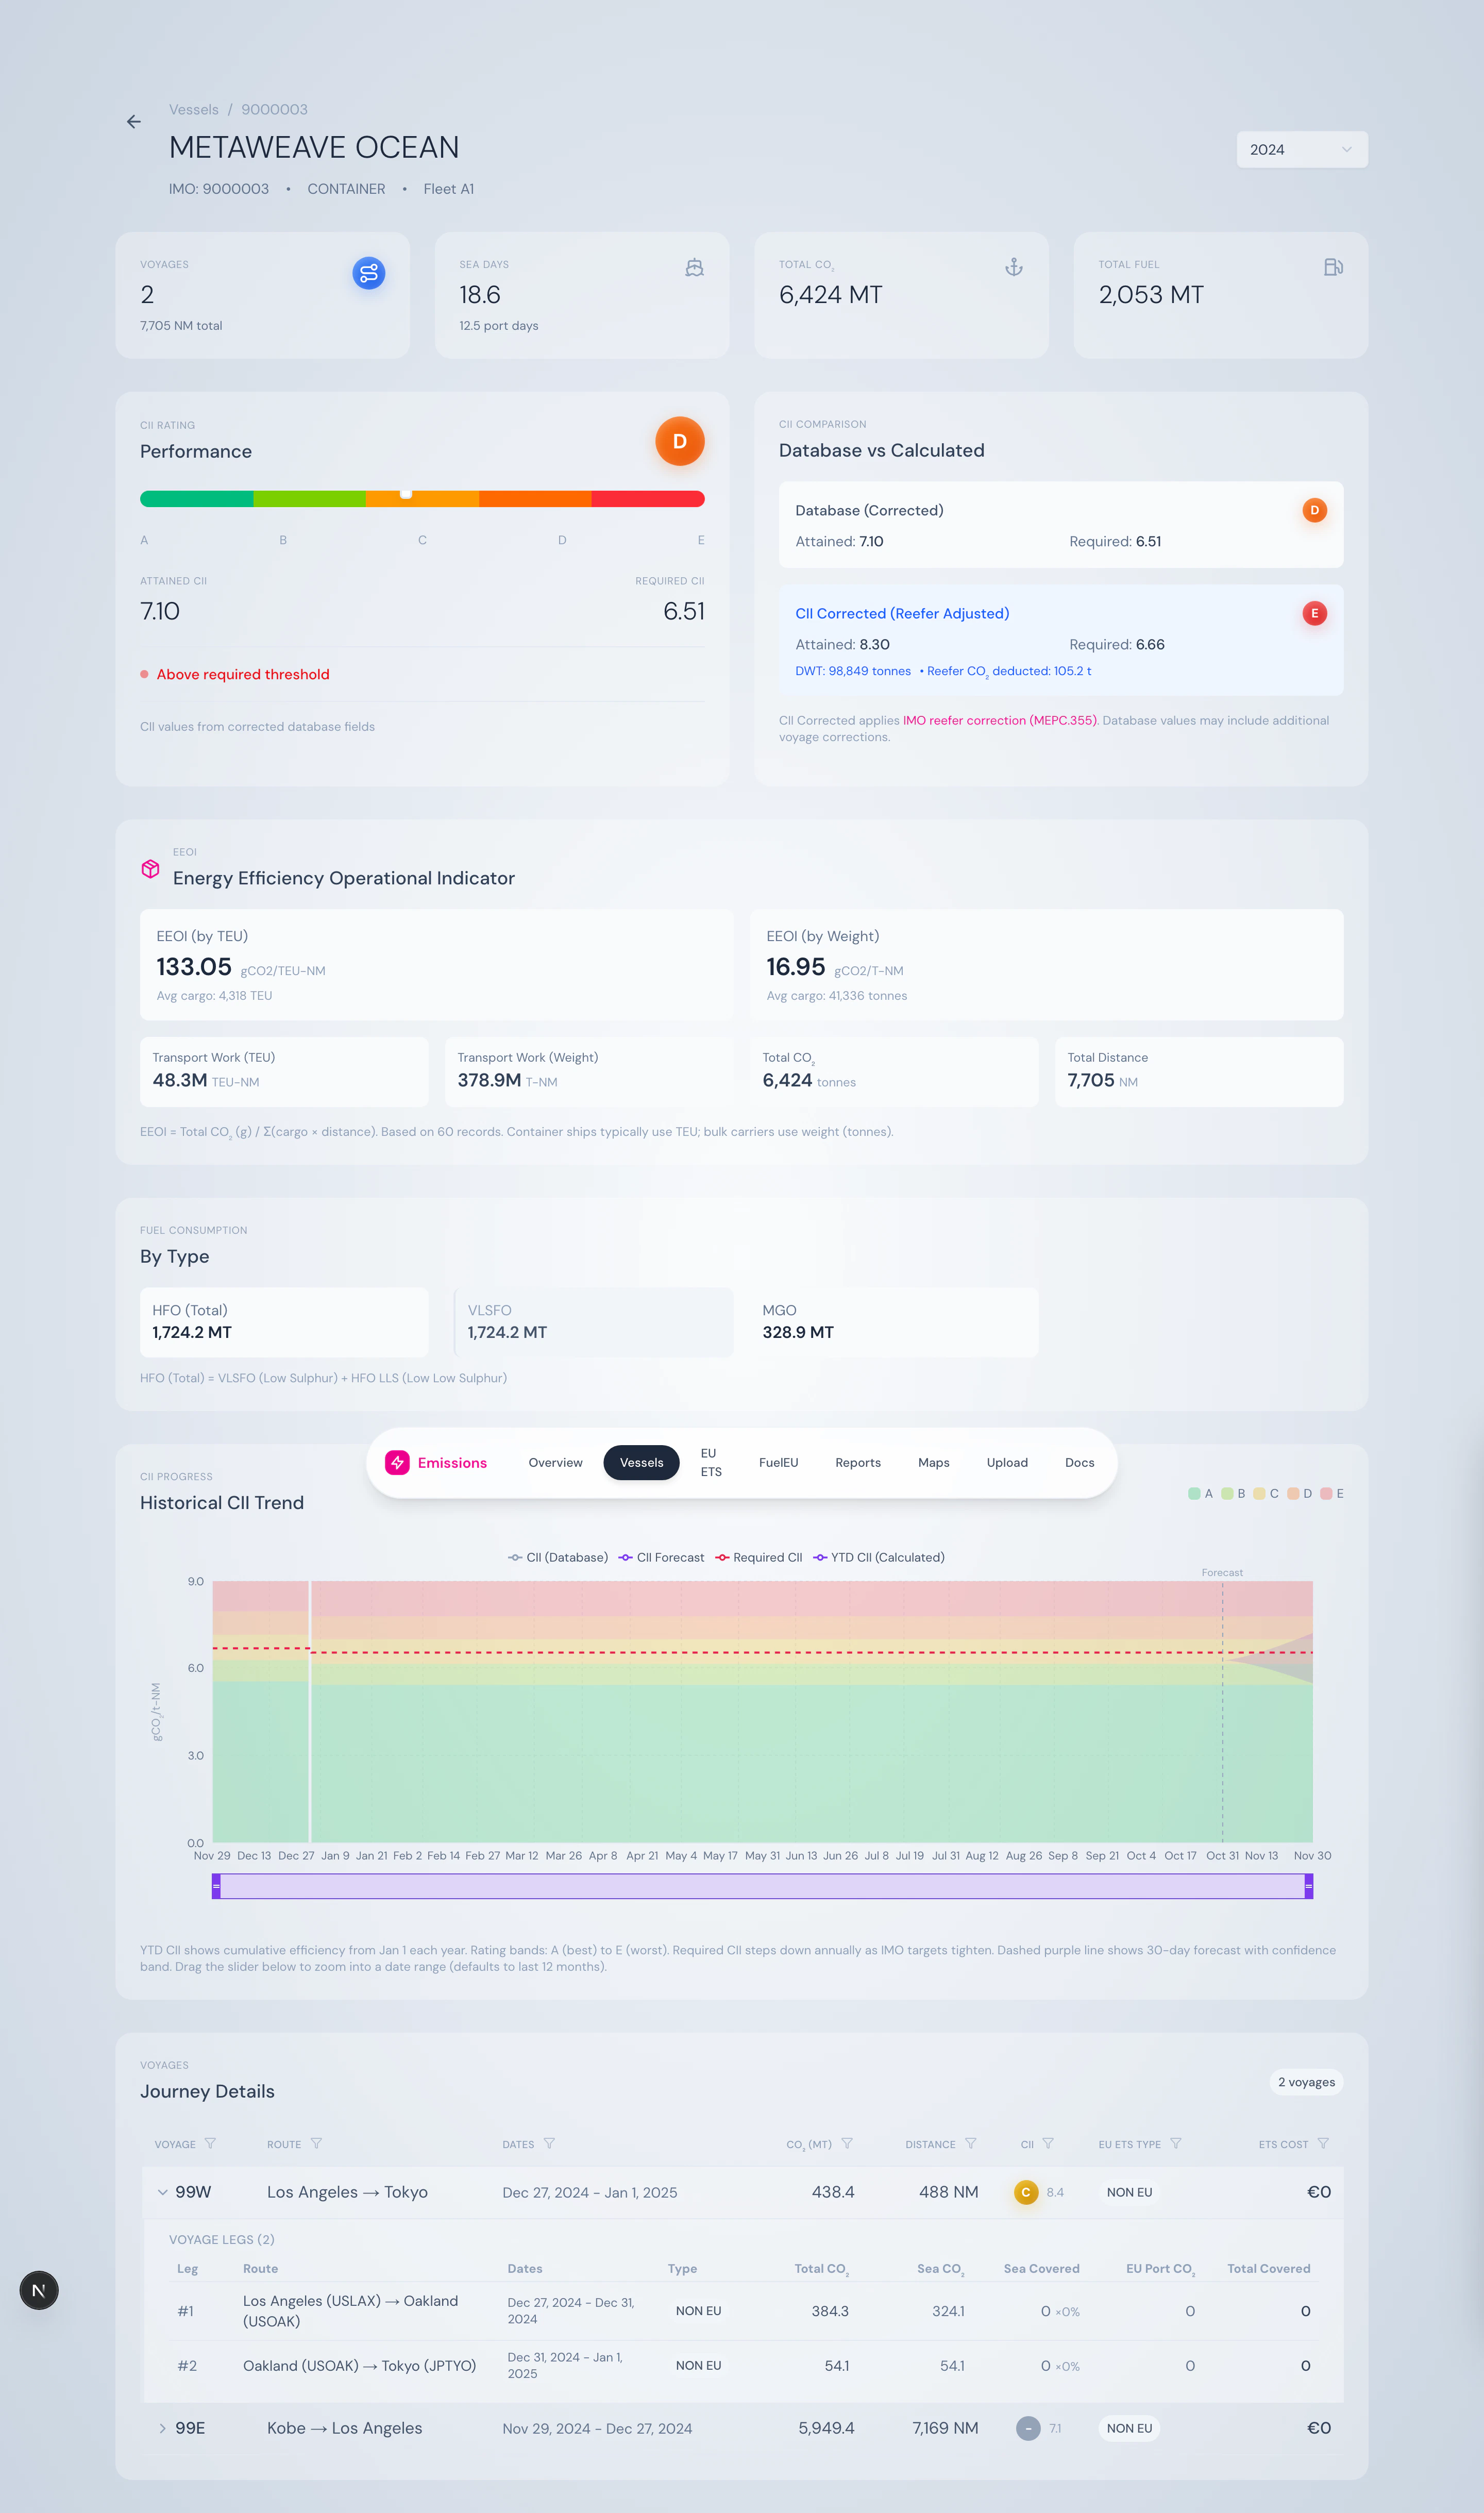
Check EU ETS exposure
The EU ETS dashboard shows the year’s phase-in factor, voyage classification breakdown, and cost projection at the configured EUA price.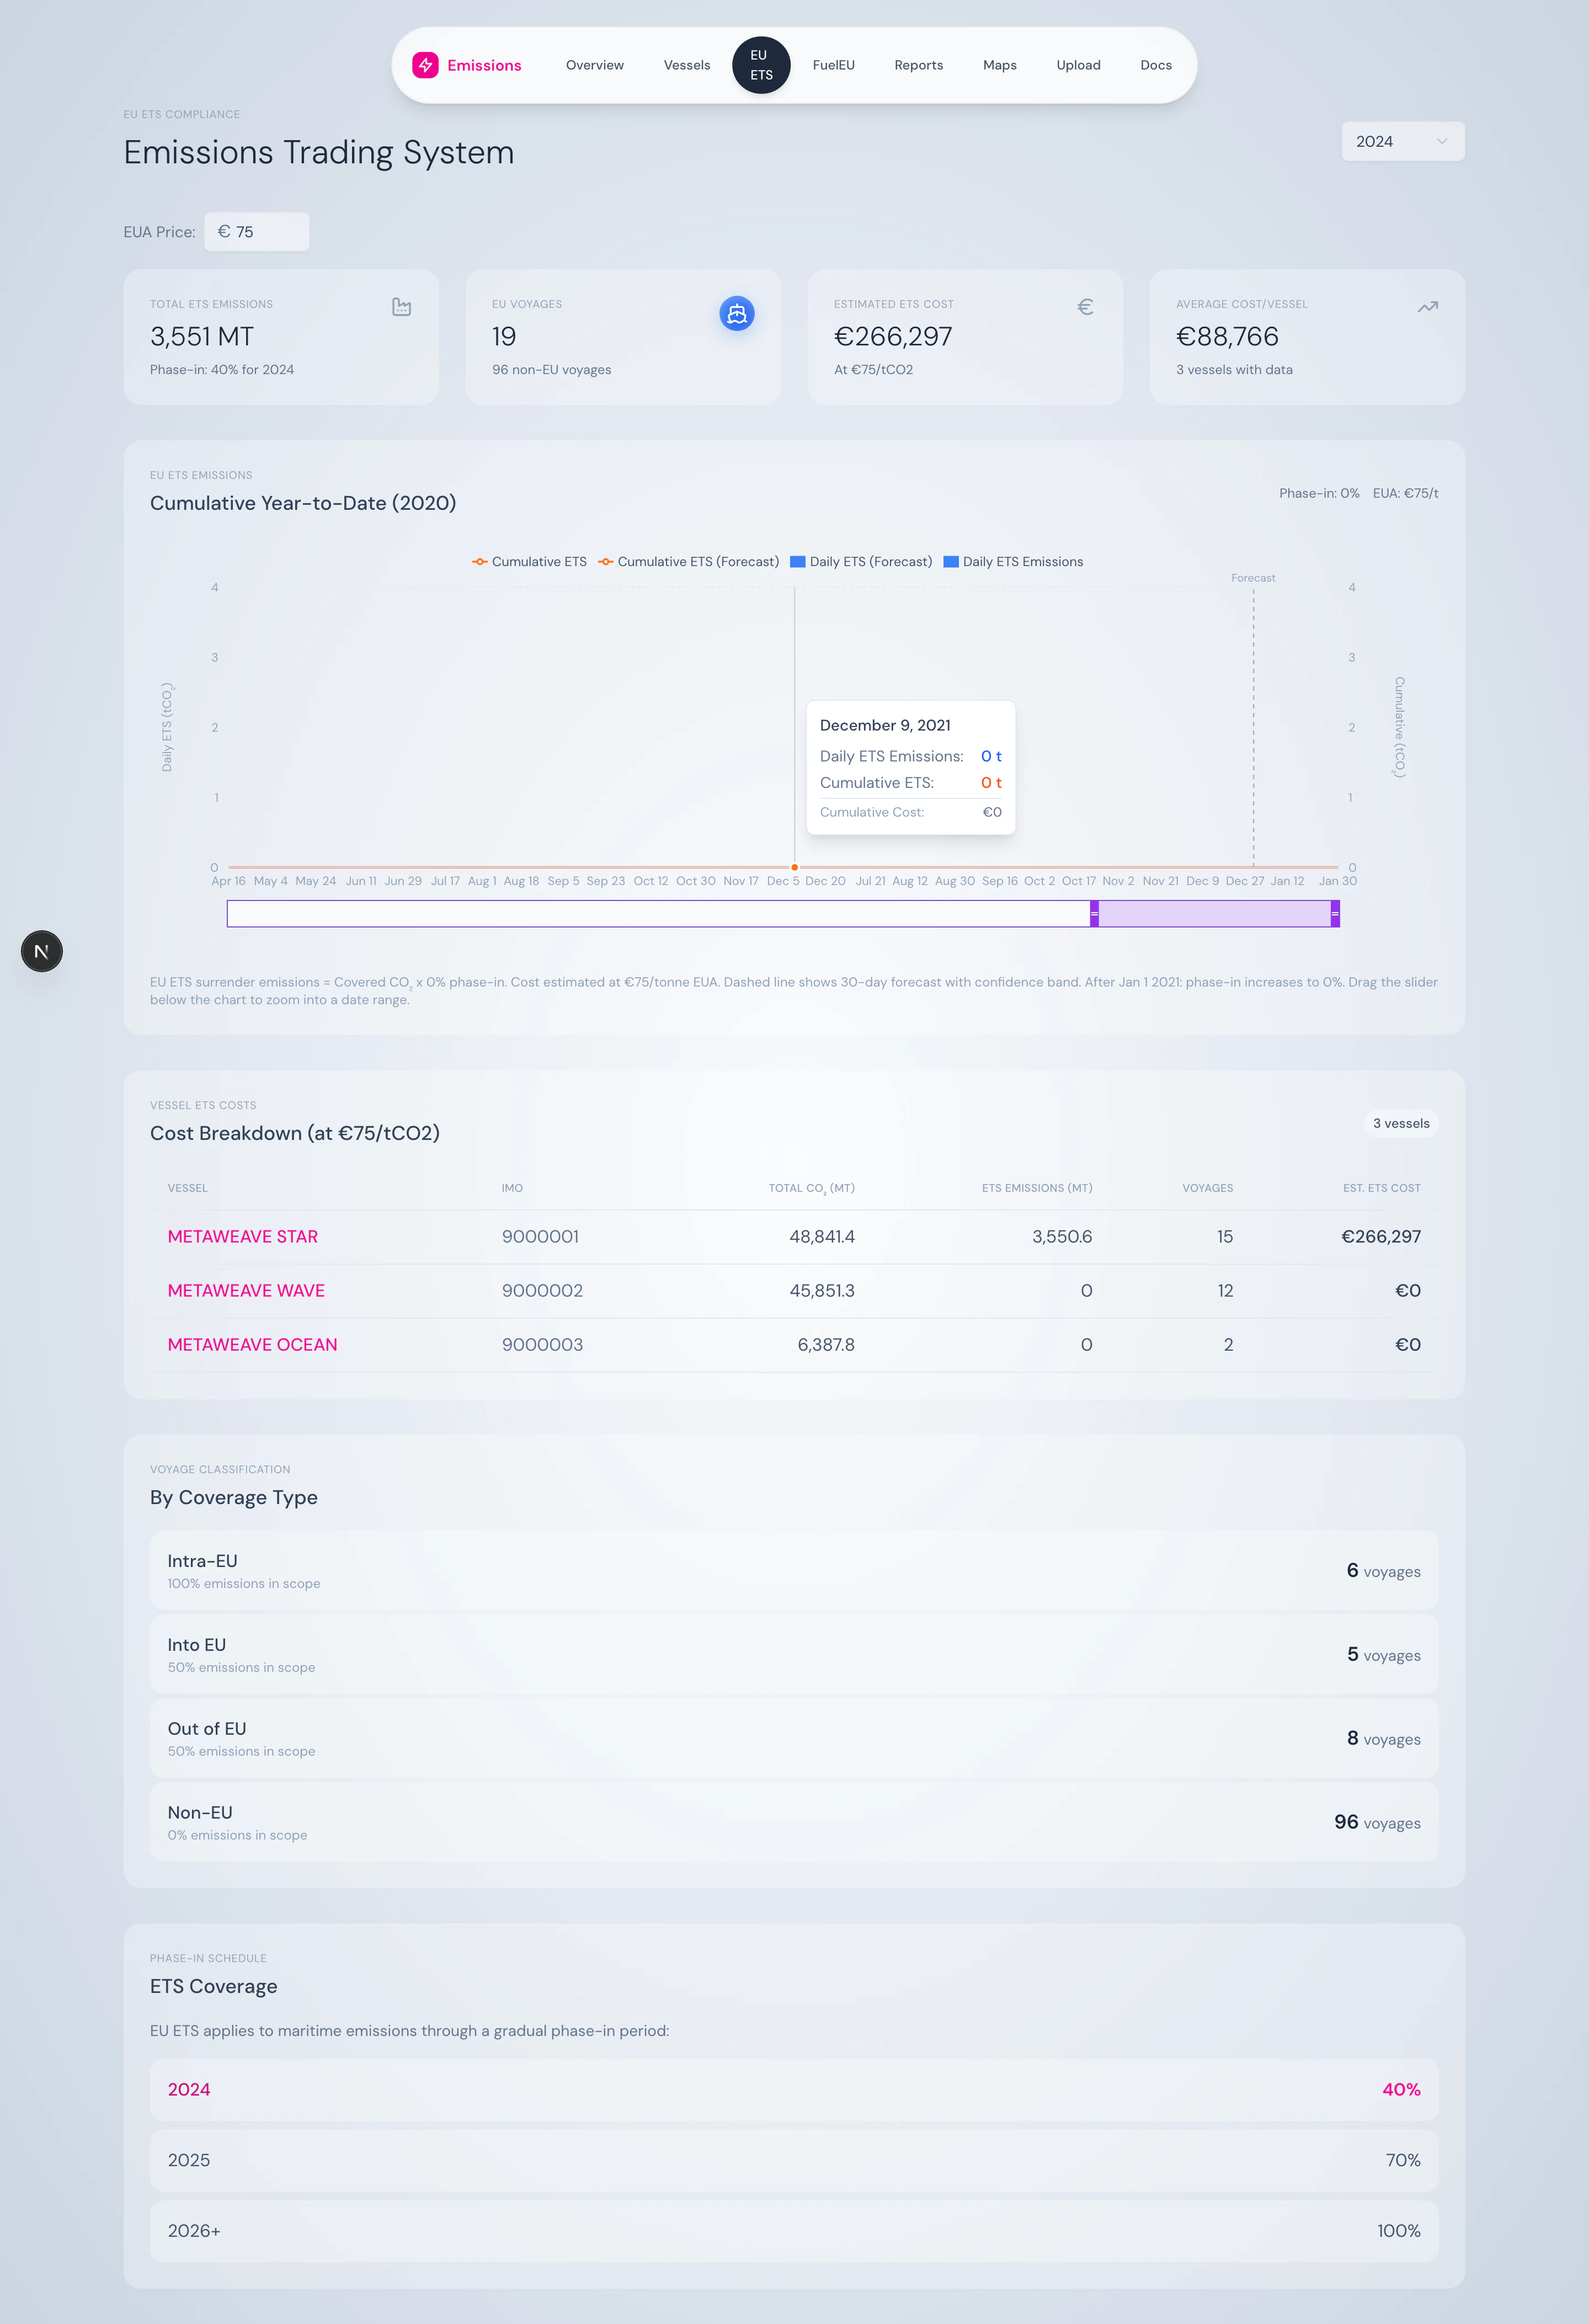
Where to go next
Compliance frameworks
Read primers on each regulation the platform handles.
Product tour
A page-by-page walkthrough with every screen and feature.
Methodology
Formulas, constants, and references behind every calculation.
Upload your data
Excel format, validation, and onboarding new vessels.