What this tab does
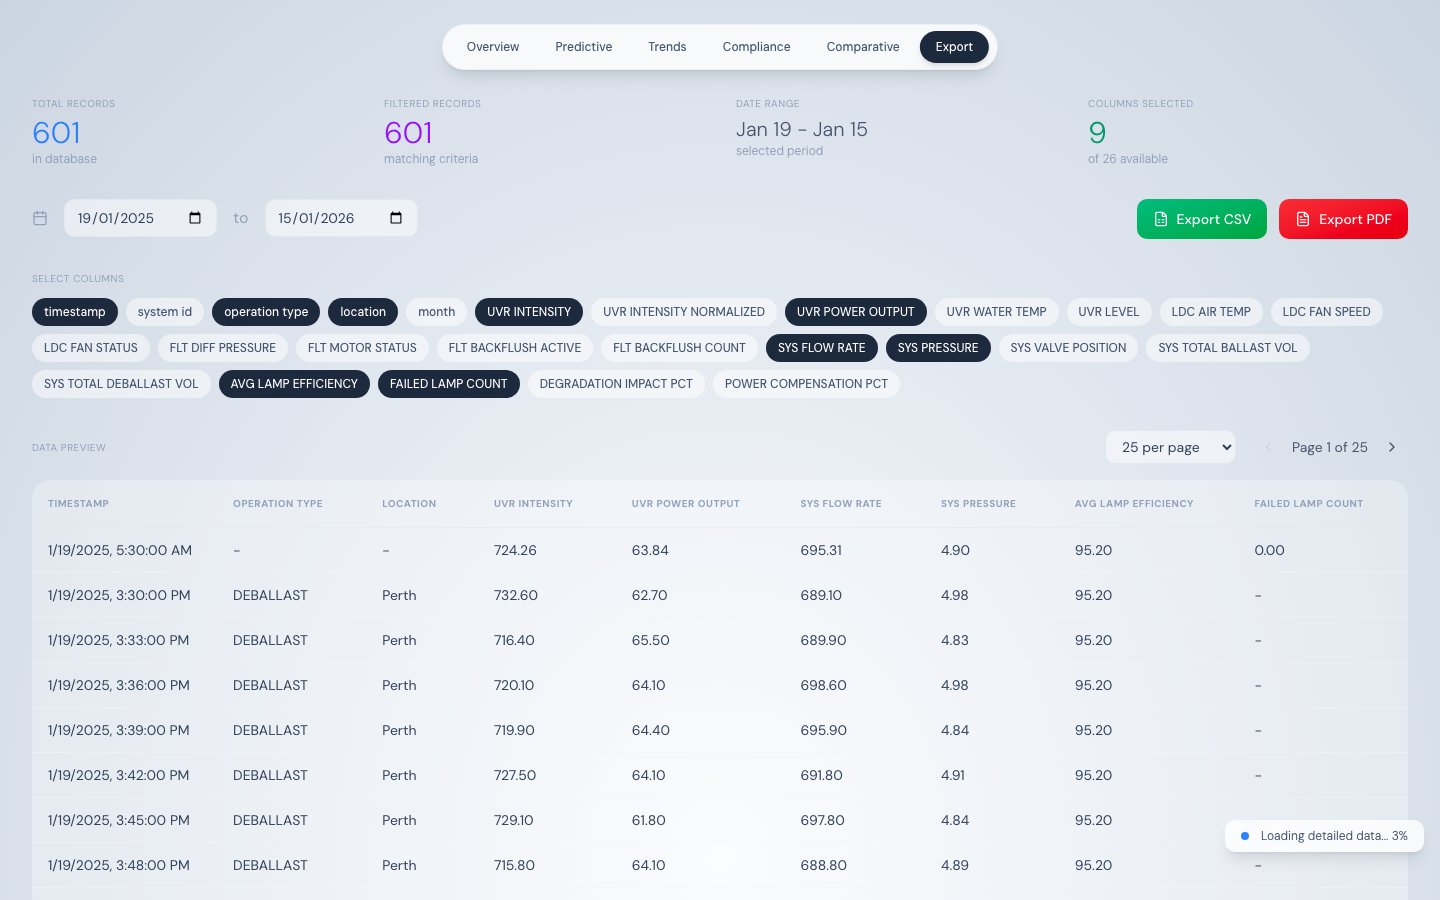
The Data Export tab loads the full telemetry dataset and provides a spreadsheet-like interface to filter, preview, and export records as CSV or PDF. It is the primary tool for extracting compliance evidence and operational reports.
How data loads
This tab always loads the maximum dataset:
- Stage 1 — Fetches one year of daily aggregated data for an instant initial table view
- Stage 2 — Streams raw 500-record chunks until all records are loaded
All filtering, sorting, and export operations run client-side on the fully-loaded dataset, so no additional API calls are needed after streaming completes.
Column selector
Toggle buttons at the top of the tab control which columns appear in the table and are included in exports. Default selection:
timestamp, operation_type, location, UVR_INTENSITY, UVR_POWER_OUTPUT, SYS_FLOW_RATE, SYS_PRESSURE, AVG_LAMP_EFFICIENCY, FAILED_LAMP_COUNT
All 26 exportable columns
| Column | Type | Description |
|---|
timestamp | datetime | Record timestamp |
system_id | text | System identifier |
operation_type | text | BALLAST or DEBALLAST |
location | text | Port name |
month | integer | Month number |
UVR_INTENSITY | number | UV intensity W/m² |
UVR_INTENSITY_NORMALIZED | number | Temperature-corrected intensity W/m² |
UVR_POWER_OUTPUT | number | Power output % of rated |
UVR_WATER_TEMP | number | Water temperature °C |
UVR_LEVEL | text | UV level descriptor |
LDC_AIR_TEMP | number | LDC air temperature °C |
LDC_FAN_SPEED | number | LDC fan speed RPM |
LDC_FAN_STATUS | text | Fan operational state |
FLT_DIFF_PRESSURE | number | Filter differential pressure bar |
FLT_MOTOR_STATUS | text | Filter motor state |
FLT_BACKFLUSH_ACTIVE | boolean | Backflush in progress |
FLT_BACKFLUSH_COUNT | integer | Cumulative backflush cycles |
SYS_FLOW_RATE | number | Flow rate m³/h |
SYS_PRESSURE | number | System pressure bar |
SYS_VALVE_POSITION | number | Valve opening % |
SYS_TOTAL_BALLAST_VOL | number | Cumulative ballast volume m³ |
SYS_TOTAL_DEBALLAST_VOL | number | Cumulative deballast volume m³ |
AVG_LAMP_EFFICIENCY | number | Mean efficiency of all 16 lamps % |
FAILED_LAMP_COUNT | integer | Count of FAILED-status lamps |
DEGRADATION_IMPACT_PCT | number | UV output reduction due to aging % |
POWER_COMPENSATION_PCT | number | Extra power for degradation compensation % |
Column filters (Excel-style)
Hover any column header to reveal a filter funnel icon. Click it to open a filter panel:
| Column type | Filter options |
|---|
Text (operation_type, location) | Substring match (case-insensitive) |
| Numeric | Two-condition filter with operators: >, >=, <, <=, =, connected by AND |
Date (timestamp) | Date range — start date and end date |
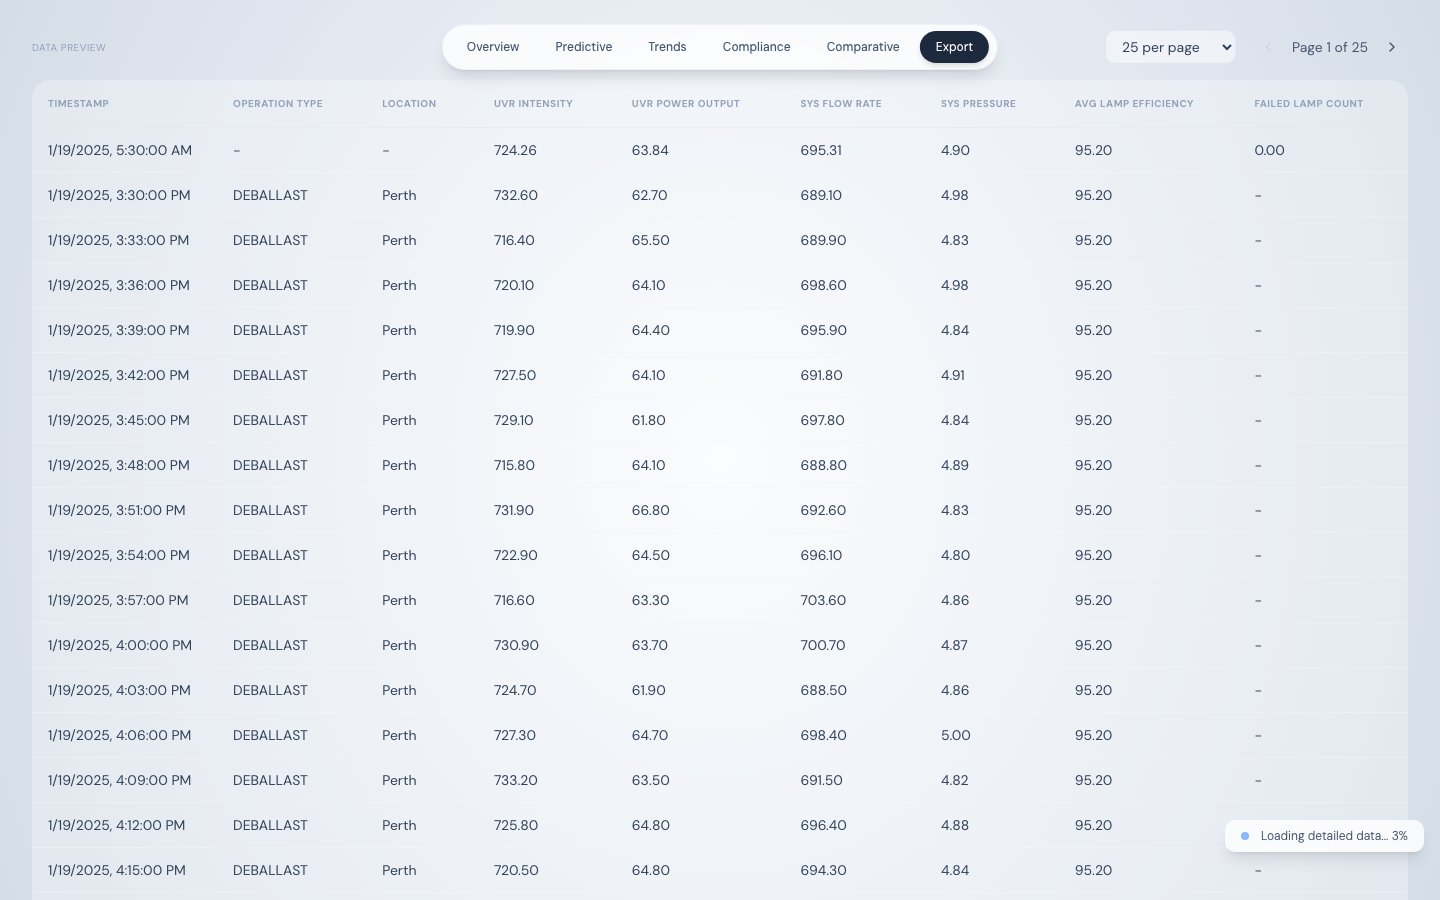
Data table
Paginated preview with configurable rows per page (25, 50, or 100). The table shows only selected columns with active filters applied. The record count above the table updates to reflect the filtered row count.
Exporting data
| Format | Library | Scope | File name |
|---|
| CSV | PapaParse | All filtered rows (not just current page) | bwts_telemetry_YYYY-MM-DD.csv |
| PDF | jsPDF + AutoTable | First 100 rows of filtered data | bwts_telemetry_YYYY-MM-DD.pdf |
For compliance submissions, export CSV with columns timestamp, operation_type, location, and UVR_INTENSITY. Filter by date range to cover the voyage in question. This provides a timestamped intensity record for every ballasting event — suitable for supplementary Ballast Water Record Book documentation.
Source
| Stage | Endpoint |
|---|
| Stage 1 | /api/telemetry/aggregated?interval=day&hours=8760 |
| Stage 2 | /api/telemetry/chunked?startDate=...&endDate=...&offset=...&limit=500 |