What it is
EU ETS (Emissions Trading System) puts a price on carbon. From 2024 it covers maritime CO₂ on voyages touching EU/EEA ports. Each tonne of covered CO₂ requires the surrender of one EUA (EU Allowance), purchased at market rate.Who it applies to
Cargo and passenger ships 5,000 GT and above calling at EU/EEA ports — under Directive 2003/87/EC as amended by Directive (EU) 2023/959.Two factors determine your bill
1. Voyage coverage by leg type
Each voyage leg is classified by its endpoints:| Leg type | Departure | Arrival | Coverage |
|---|---|---|---|
| INTRA_EU | EU/EEA port | EU/EEA port | 100% |
| INTO_EU | Non-EU port | EU/EEA port | 50% |
| OUT_OF_EU | EU/EEA port | Non-EU port | 50% |
| NON_EU | Non-EU port | Non-EU port | 0% |
2. Phase-in factor by year
Maritime ETS is phased in over three years:| Year | Phase-in |
|---|---|
| 2024 | 40% |
| 2025 | 70% |
| 2026 onwards | 100% |
DEFAULT_EUA_PRICE environment variable (defaults to €75/tonne).
What the platform calculates
For every voyage, the platform:- Walks the consumption log chronologically
- Detects each BOSP (Beginning of Sea Passage) event as a leg boundary
- Splits each record into sea CO₂ vs. port CO₂ vs. EU-port CO₂ vs. non-EU-port CO₂
- Applies the leg’s coverage factor to sea CO₂; applies 100% / 0% per-record to port CO₂
- Sums covered CO₂ across all legs and multiplies by the year’s phase-in factor
What you see in the product
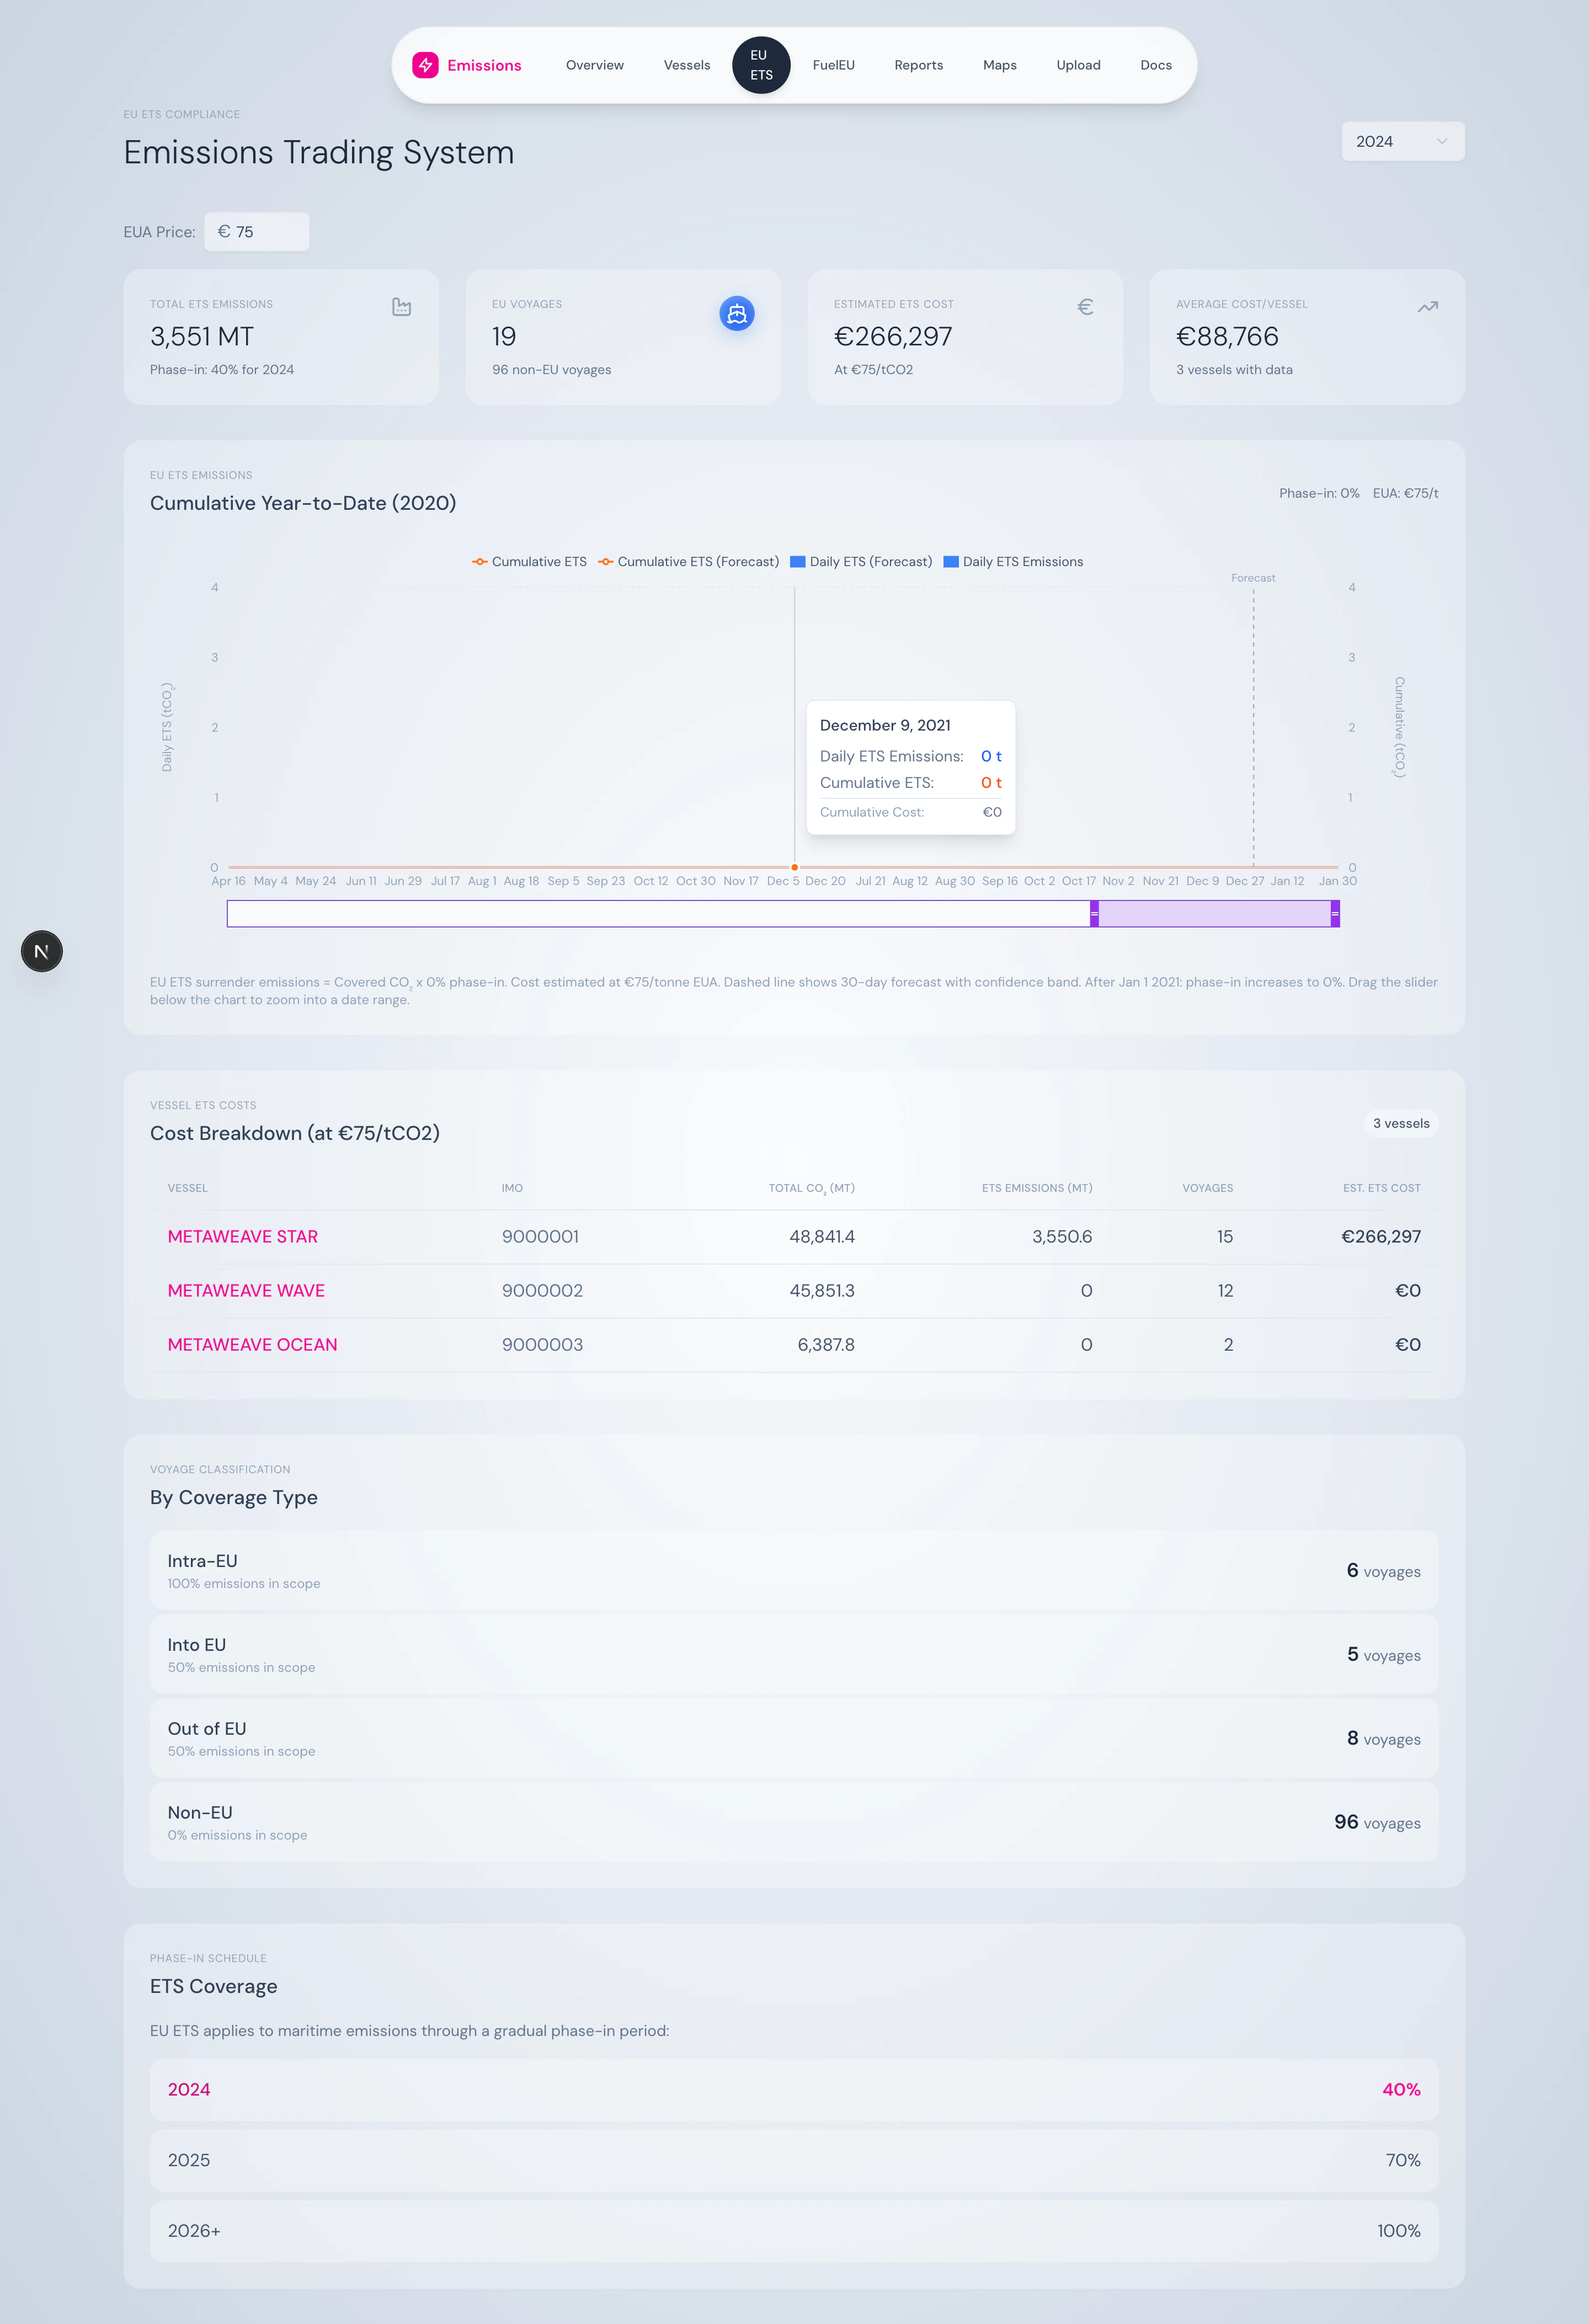
- Fleet view: Phase-in banner highlighting the current year, voyage-type breakdown, and total cost projection
- Vessel view: Expandable voyages table showing each leg’s coverage factor and covered CO₂
- Reports: Downloadable EU ETS report for verifier submission
Reference
Primary regulations
- Directive 2003/87/EC (consolidated) — EU ETS directive including maritime provisions
- Directive (EU) 2023/959 — Amendment that brought maritime into EU ETS
- Regulation (EU) 2015/757 (consolidated) — EU MRV (the data feed for ETS)
Industry guides
- DNV — EU ETS Maritime
- CE Delft — FuelEU Maritime and EU ETS Report
- Sustainable Ships — EU ETS Maritime Guide
Carbon market data
- ICAP ETS Map — global ETS overview
- Ember Carbon Price Tracker — live EUA price