What it is
CII (Carbon Intensity Indicator) is the IMO’s operational efficiency metric. It measures the grams of CO₂ a ship emits per tonne (or TEU) of cargo capacity per nautical mile sailed. Each year IMO publishes a target — the Required CII — and ships are graded A through E based on how close their Attained CII comes to that target.Who it applies to
All cargo, RoPax, and cruise ships of 5,000 GT or above trading internationally. Ratings have been published annually since 2023 (under Regulation MARPOL Annex VI, Chapter 4). A D rating for three consecutive years or a single E rating triggers a mandatory corrective action plan.What the platform calculates
For every vessel and every year, the platform computes:- Reference CII — the 2019 baseline, using the IMO formula
CII_ref = a × Capacity^(-c)with ship-type-specificaandcvalues - Required CII — the reference reduced by the year’s reduction factor (5% in 2023 rising to 19% in 2030, then 2% per year beyond)
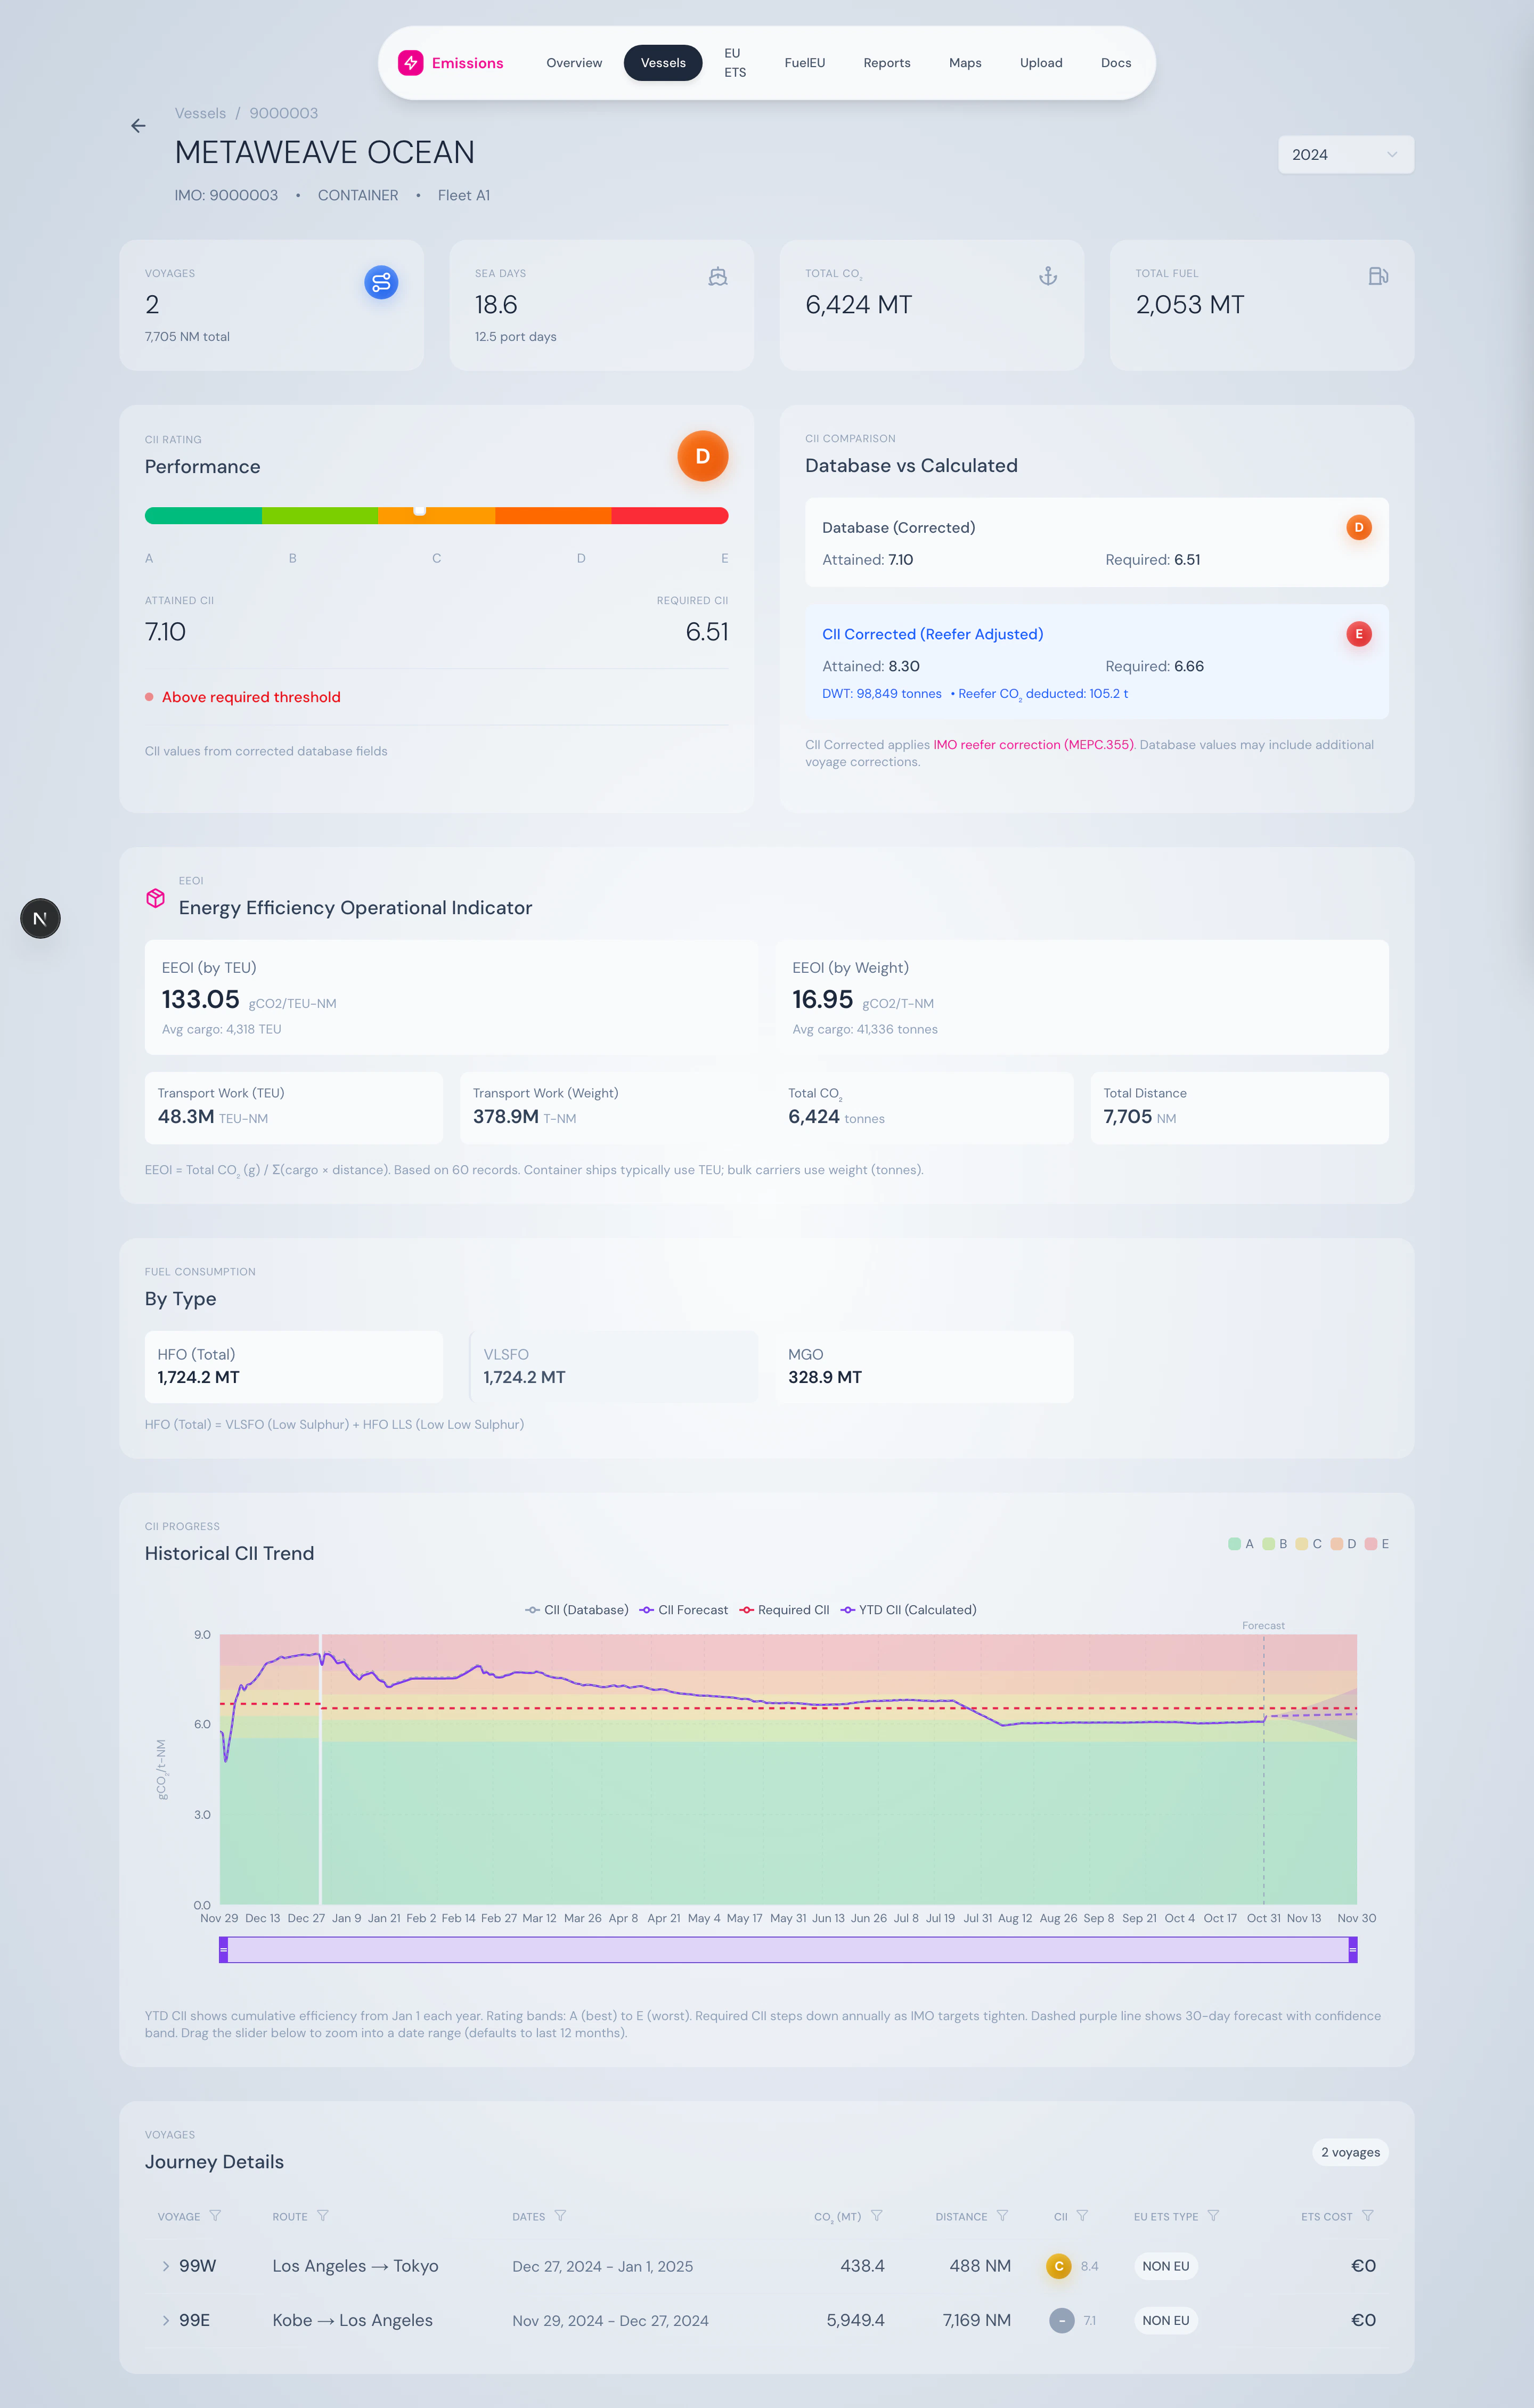
- Attained CII — the actual operational result, in gCO₂ per tonne-NM
- Rating (A–E) — using ship-type-specific d-factors applied to the Required CII as boundary multipliers
- Compliance margin — Required minus Attained (positive is good)
- Reefer-corrected CII — the same calculation with reefer container CO₂ stripped out per MEPC.355(78)
Ship types supported
Eight IMO ship-type buckets, each with its owna, c, capacity basis (DWT or GT), and rating boundaries:
| Ship type | Capacity basis | a | c |
|---|---|---|---|
| Container | DWT | 1,984 | 0.489 |
| Bulk carrier | DWT | 4,745 | 0.622 |
| Tanker | DWT | 5,247 | 0.610 |
| Gas carrier | DWT | 14,405 | 0.807 |
| LNG carrier | DWT | 9,827 | 0.718 |
| General cargo | DWT | 588 | 0.388 |
| Ro-Ro | DWT | 2,023 | 0.460 |
| Cruise | GT | 930 | 0.383 |
vesselType field to one of these (e.g. “Crude Oil Tanker” → Tanker, “Car Carrier” → Ro-Ro).
What you see in the product
- Fleet view: A–E distribution donut, fleet-average CII, and a sortable table of every vessel’s rating
- Vessel view: Radial gauge plotting Attained against the A/B/C/D/E bands, side-by-side comparison of database vs. reefer-corrected CII, and a rolling chart of daily CII over 12+ months with stepped Required-CII lines per year
- Methodology page: Interactive calculators for Required and Attained CII so you can sanity-check inputs
Output
A downloadable CII Statement of Compliance for each vessel, formatted for flag-state submission. See Reports hub.Reference
Primary regulations
- IMO MEPC.353(78) — CII reference lines (a, c coefficients by ship type)
- IMO MEPC.354(78) — CII rating boundaries (d-vector values)
- IMO MEPC.355(78) — Reefer correction guidelines
- IMO MEPC.339(76) — AER/CII methodology and calculation guidelines
- IMO MEPC.364(79) — 2023 Guidelines on CO₂ emission factors
Industry guides
- DNV — CII Carbon Intensity Indicator
- ClassNK — CII Regulation Overview
- Open-IMO-CII-Calculator (open source reference)