> ## Documentation Index
> Fetch the complete documentation index at: https://docs.appliedaifoundation.org/llms.txt
> Use this file to discover all available pages before exploring further.
# FuelEU dashboard
> GHG intensity tracking, fuel mix analysis, and per-vessel compliance ranking.
The FuelEU dashboard is where you'll find out, on any given day, whether your fleet is on track to comply — and what a non-compliance penalty would cost.
 ## What's on the page
### Compliance banner
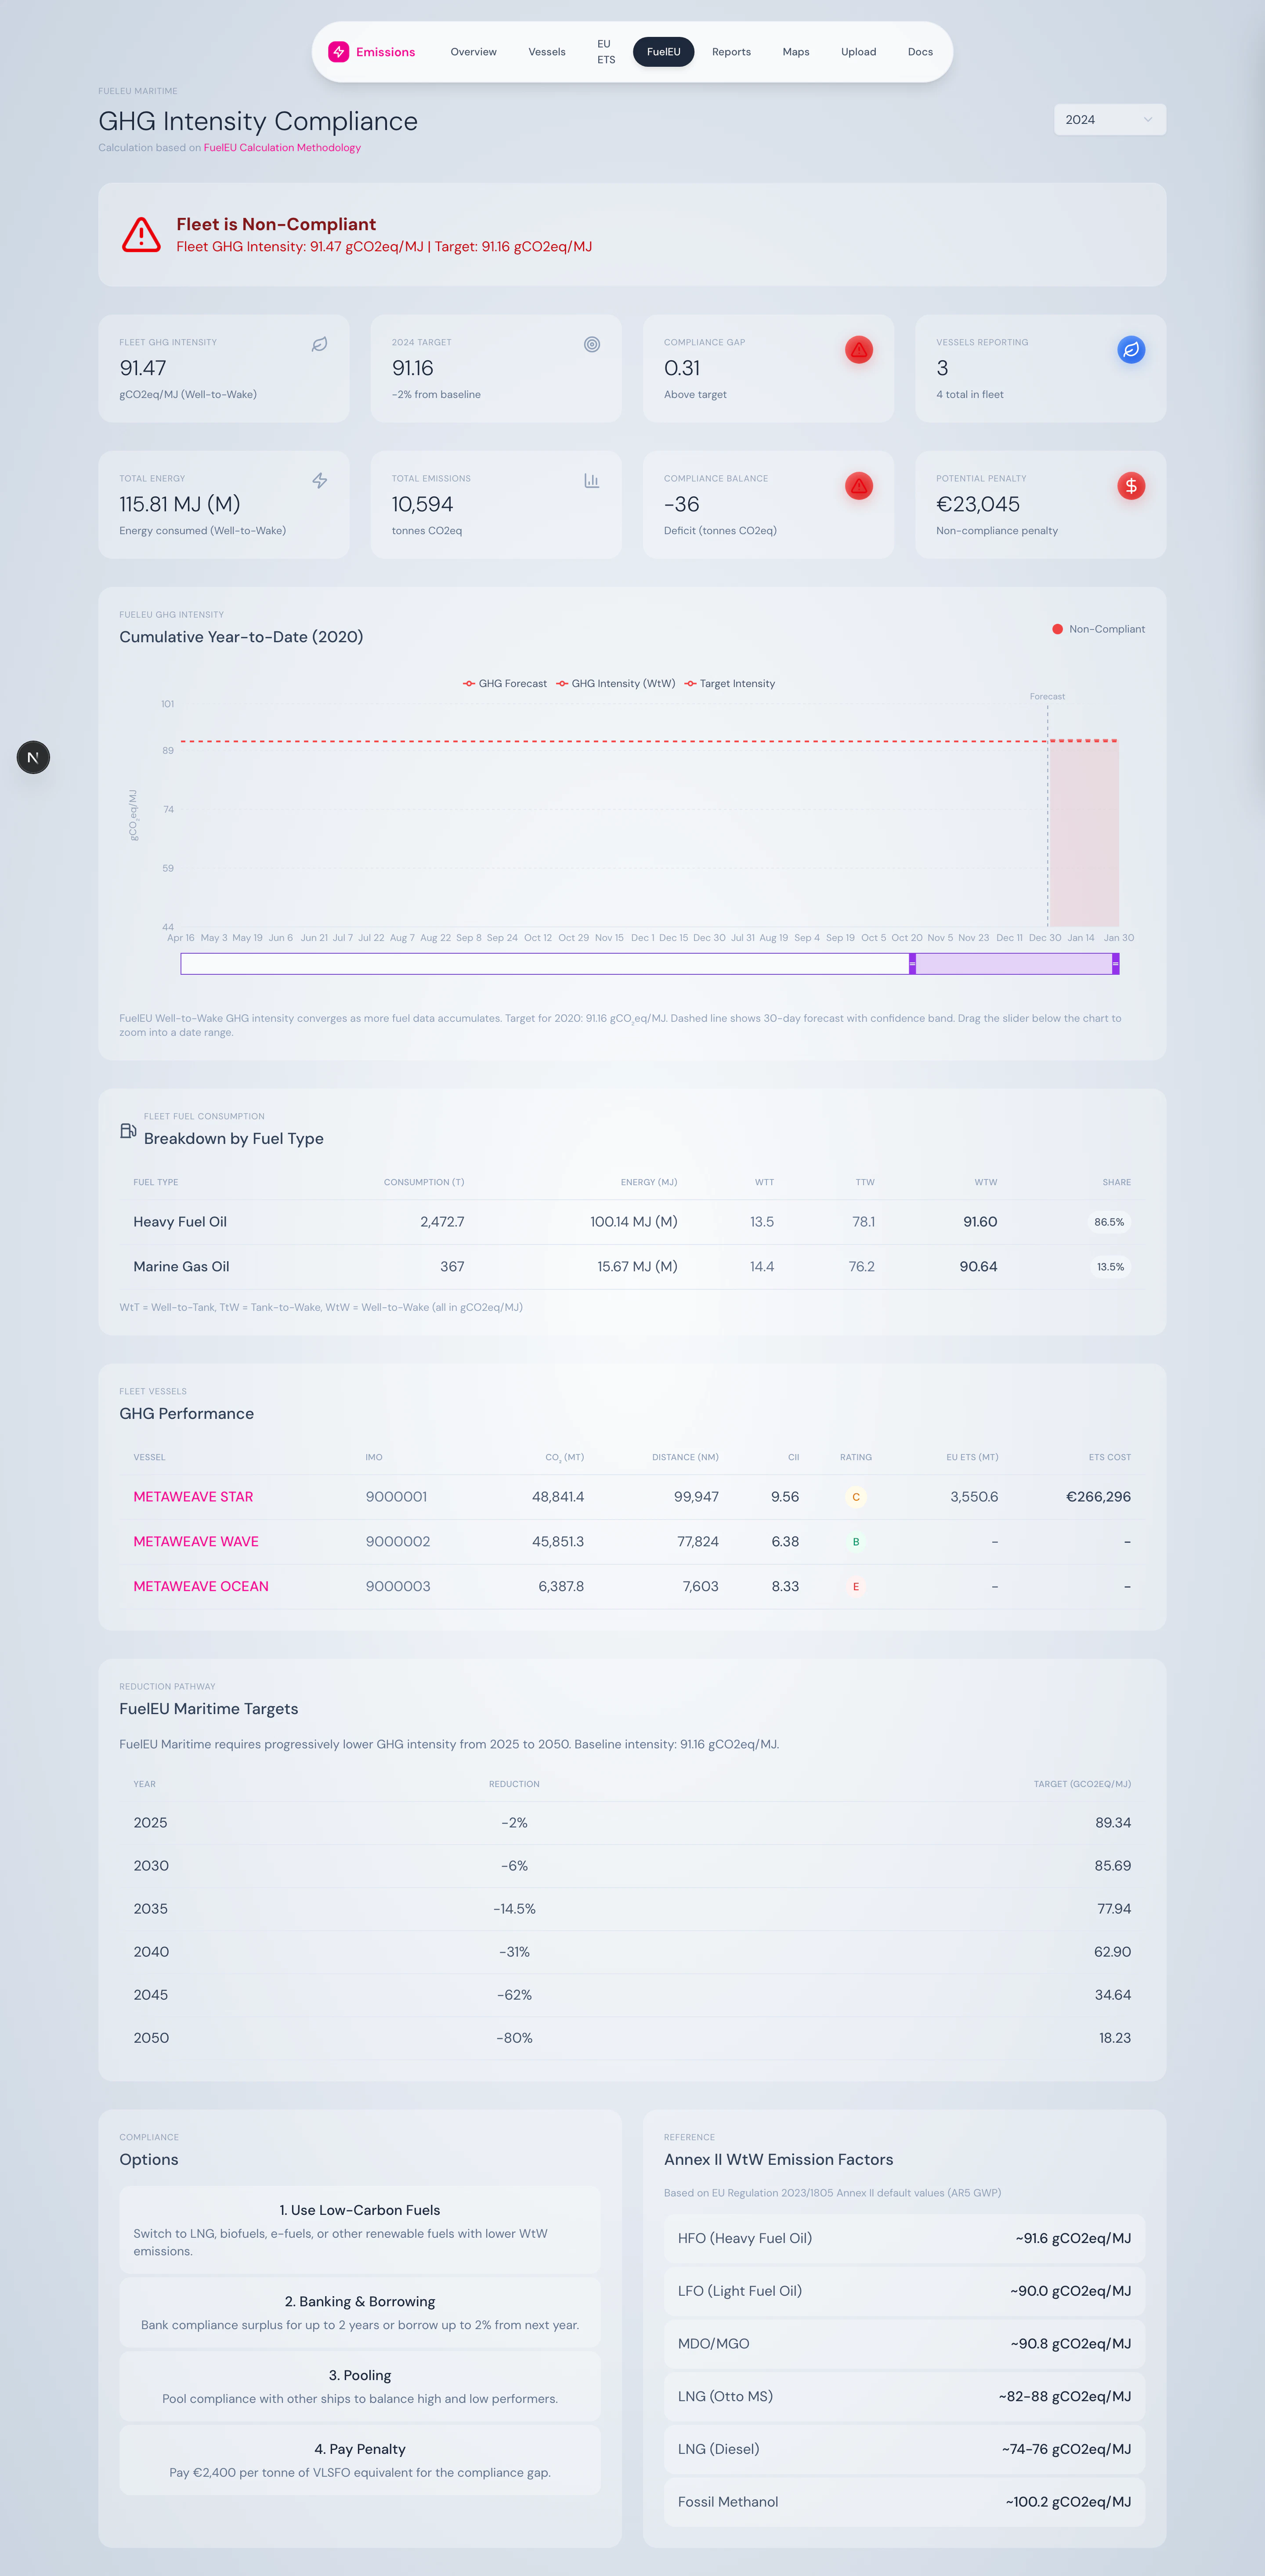
A green or red banner answers the headline question: are you compliant for the selected year? It shows fleet GHG intensity, the year's target, and the gap.
### Summary cards
* **Fleet GHG Intensity** (gCO₂eq/MJ)
* **Year target** + reduction percentage
* **Compliance Gap** — actual minus target
* **Vessels Reporting** — count
Plus a second row of energy/compliance metrics:
* **Total Energy** (MJ, formatted in TJ/GJ)
* **Total Emissions** (tonnes CO₂eq)
* **Compliance Balance** — surplus or deficit, in tonnes CO₂eq
* **Potential Penalty** (€) — calculated only if non-compliant
### Daily intensity chart
## What's on the page
### Compliance banner
A green or red banner answers the headline question: are you compliant for the selected year? It shows fleet GHG intensity, the year's target, and the gap.
### Summary cards
* **Fleet GHG Intensity** (gCO₂eq/MJ)
* **Year target** + reduction percentage
* **Compliance Gap** — actual minus target
* **Vessels Reporting** — count
Plus a second row of energy/compliance metrics:
* **Total Energy** (MJ, formatted in TJ/GJ)
* **Total Emissions** (tonnes CO₂eq)
* **Compliance Balance** — surplus or deficit, in tonnes CO₂eq
* **Potential Penalty** (€) — calculated only if non-compliant
### Daily intensity chart
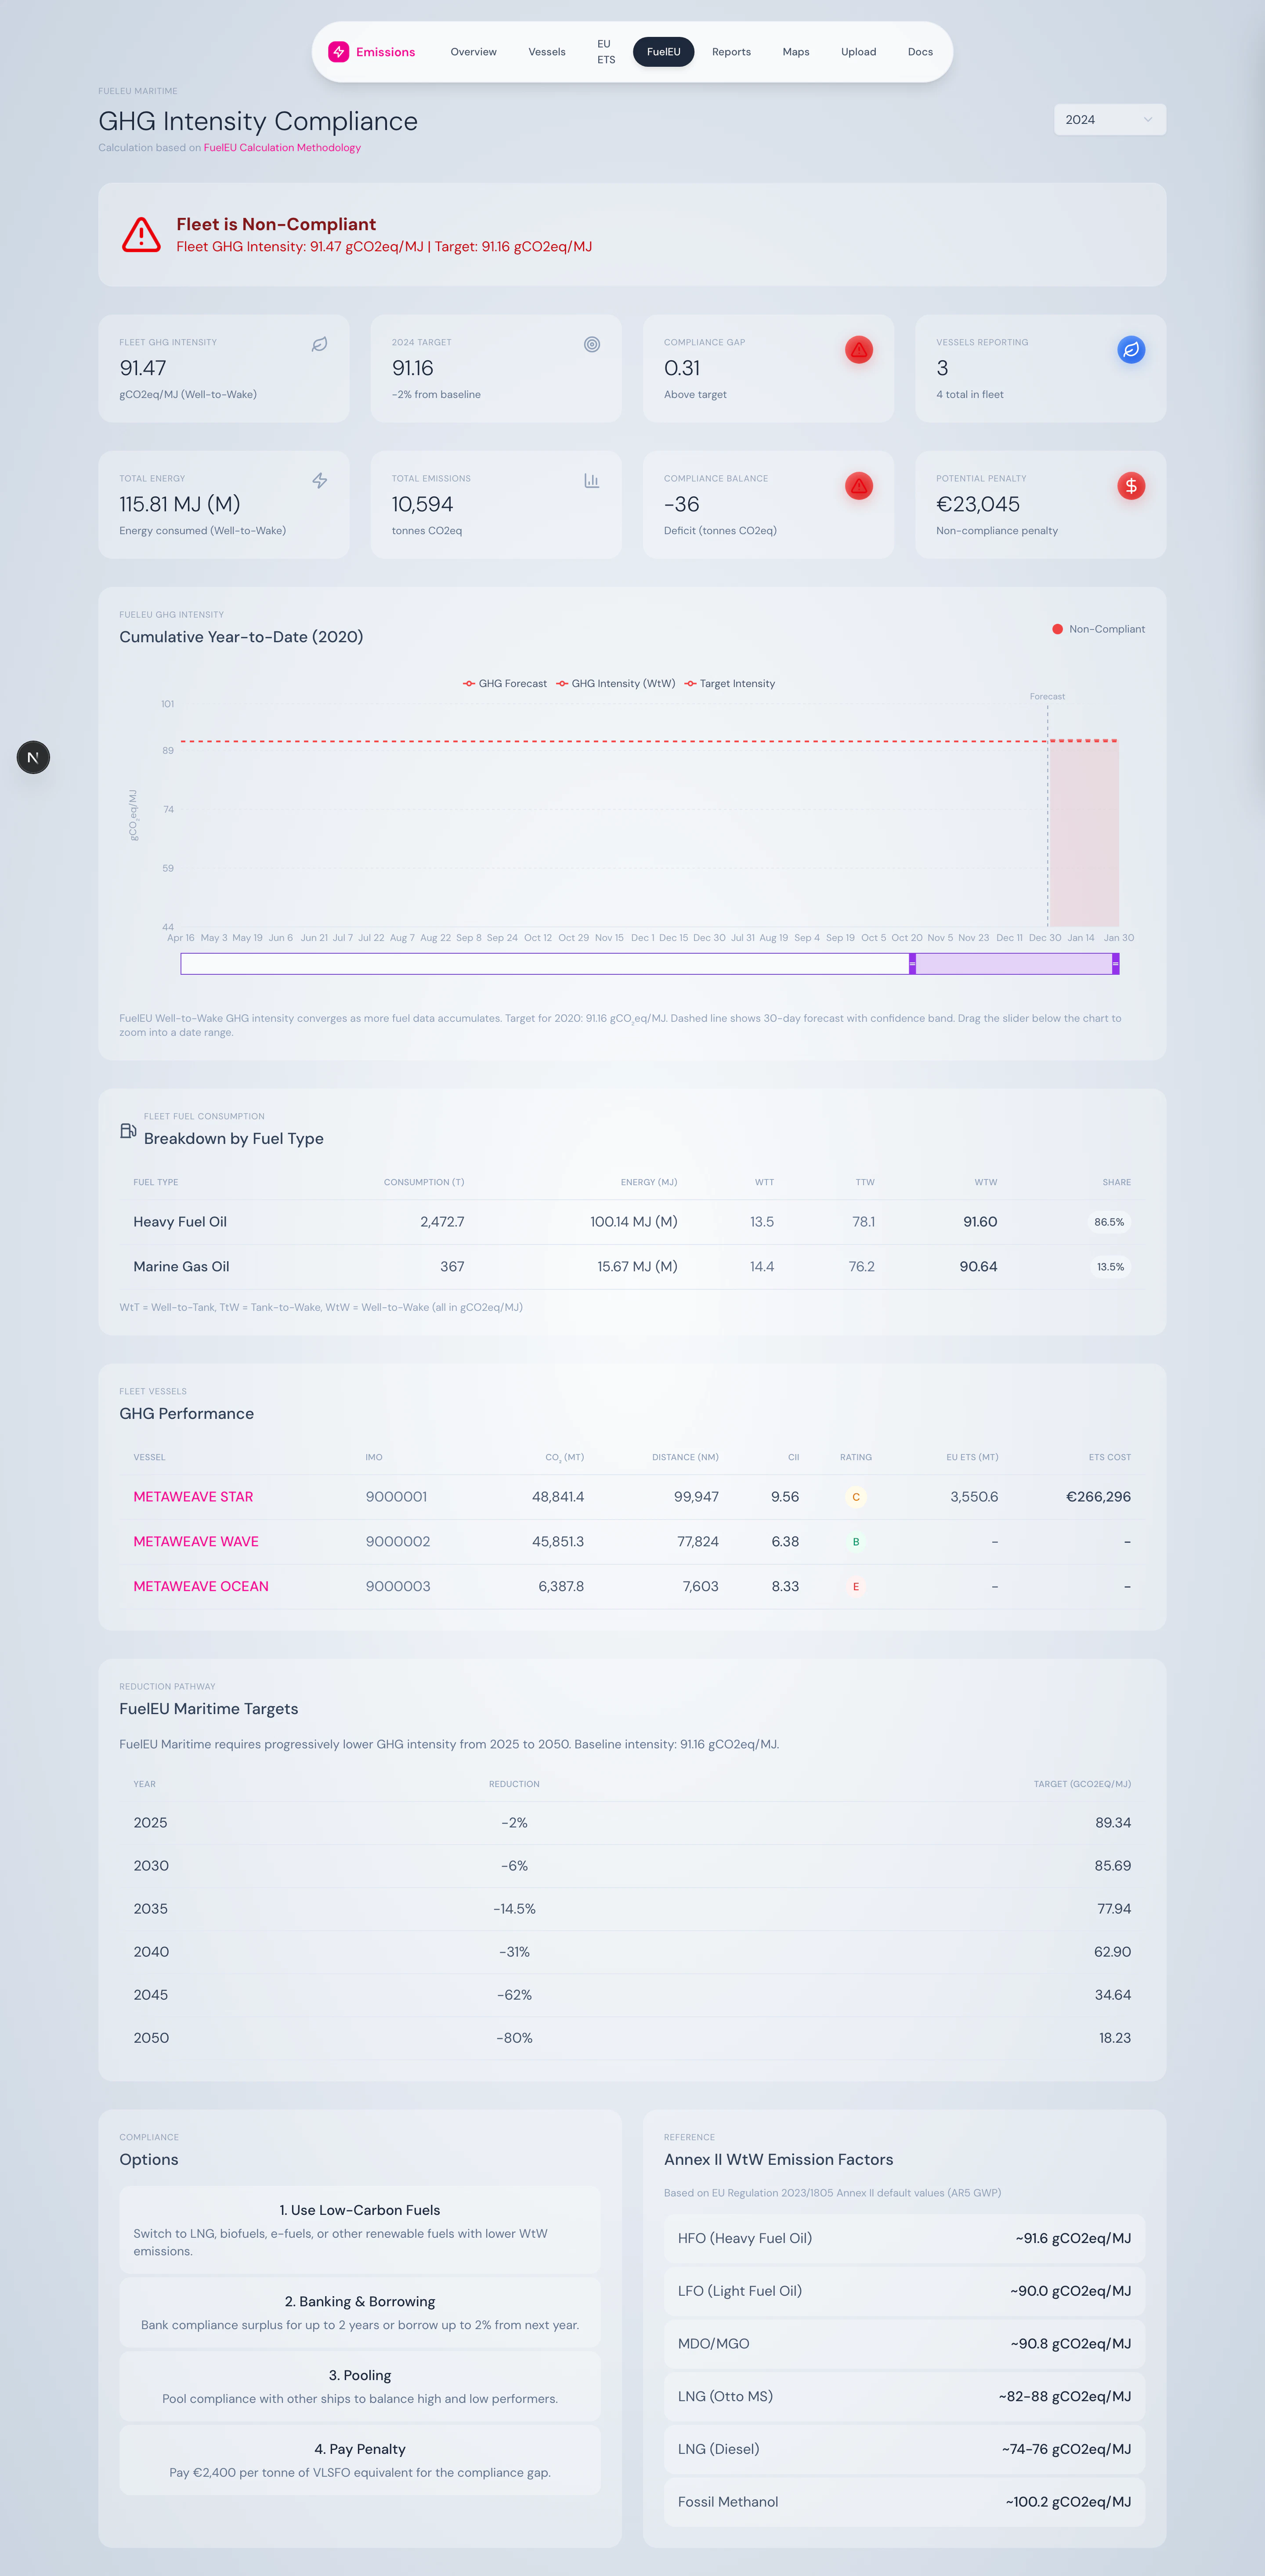 A timeline of fleet GHG intensity through the year, with the target as a horizontal threshold line. Background colour shifts indicate which periods were compliant vs. non-compliant. Hover for the exact intensity on any day.
### Fuel breakdown
A timeline of fleet GHG intensity through the year, with the target as a horizontal threshold line. Background colour shifts indicate which periods were compliant vs. non-compliant. Hover for the exact intensity on any day.
### Fuel breakdown
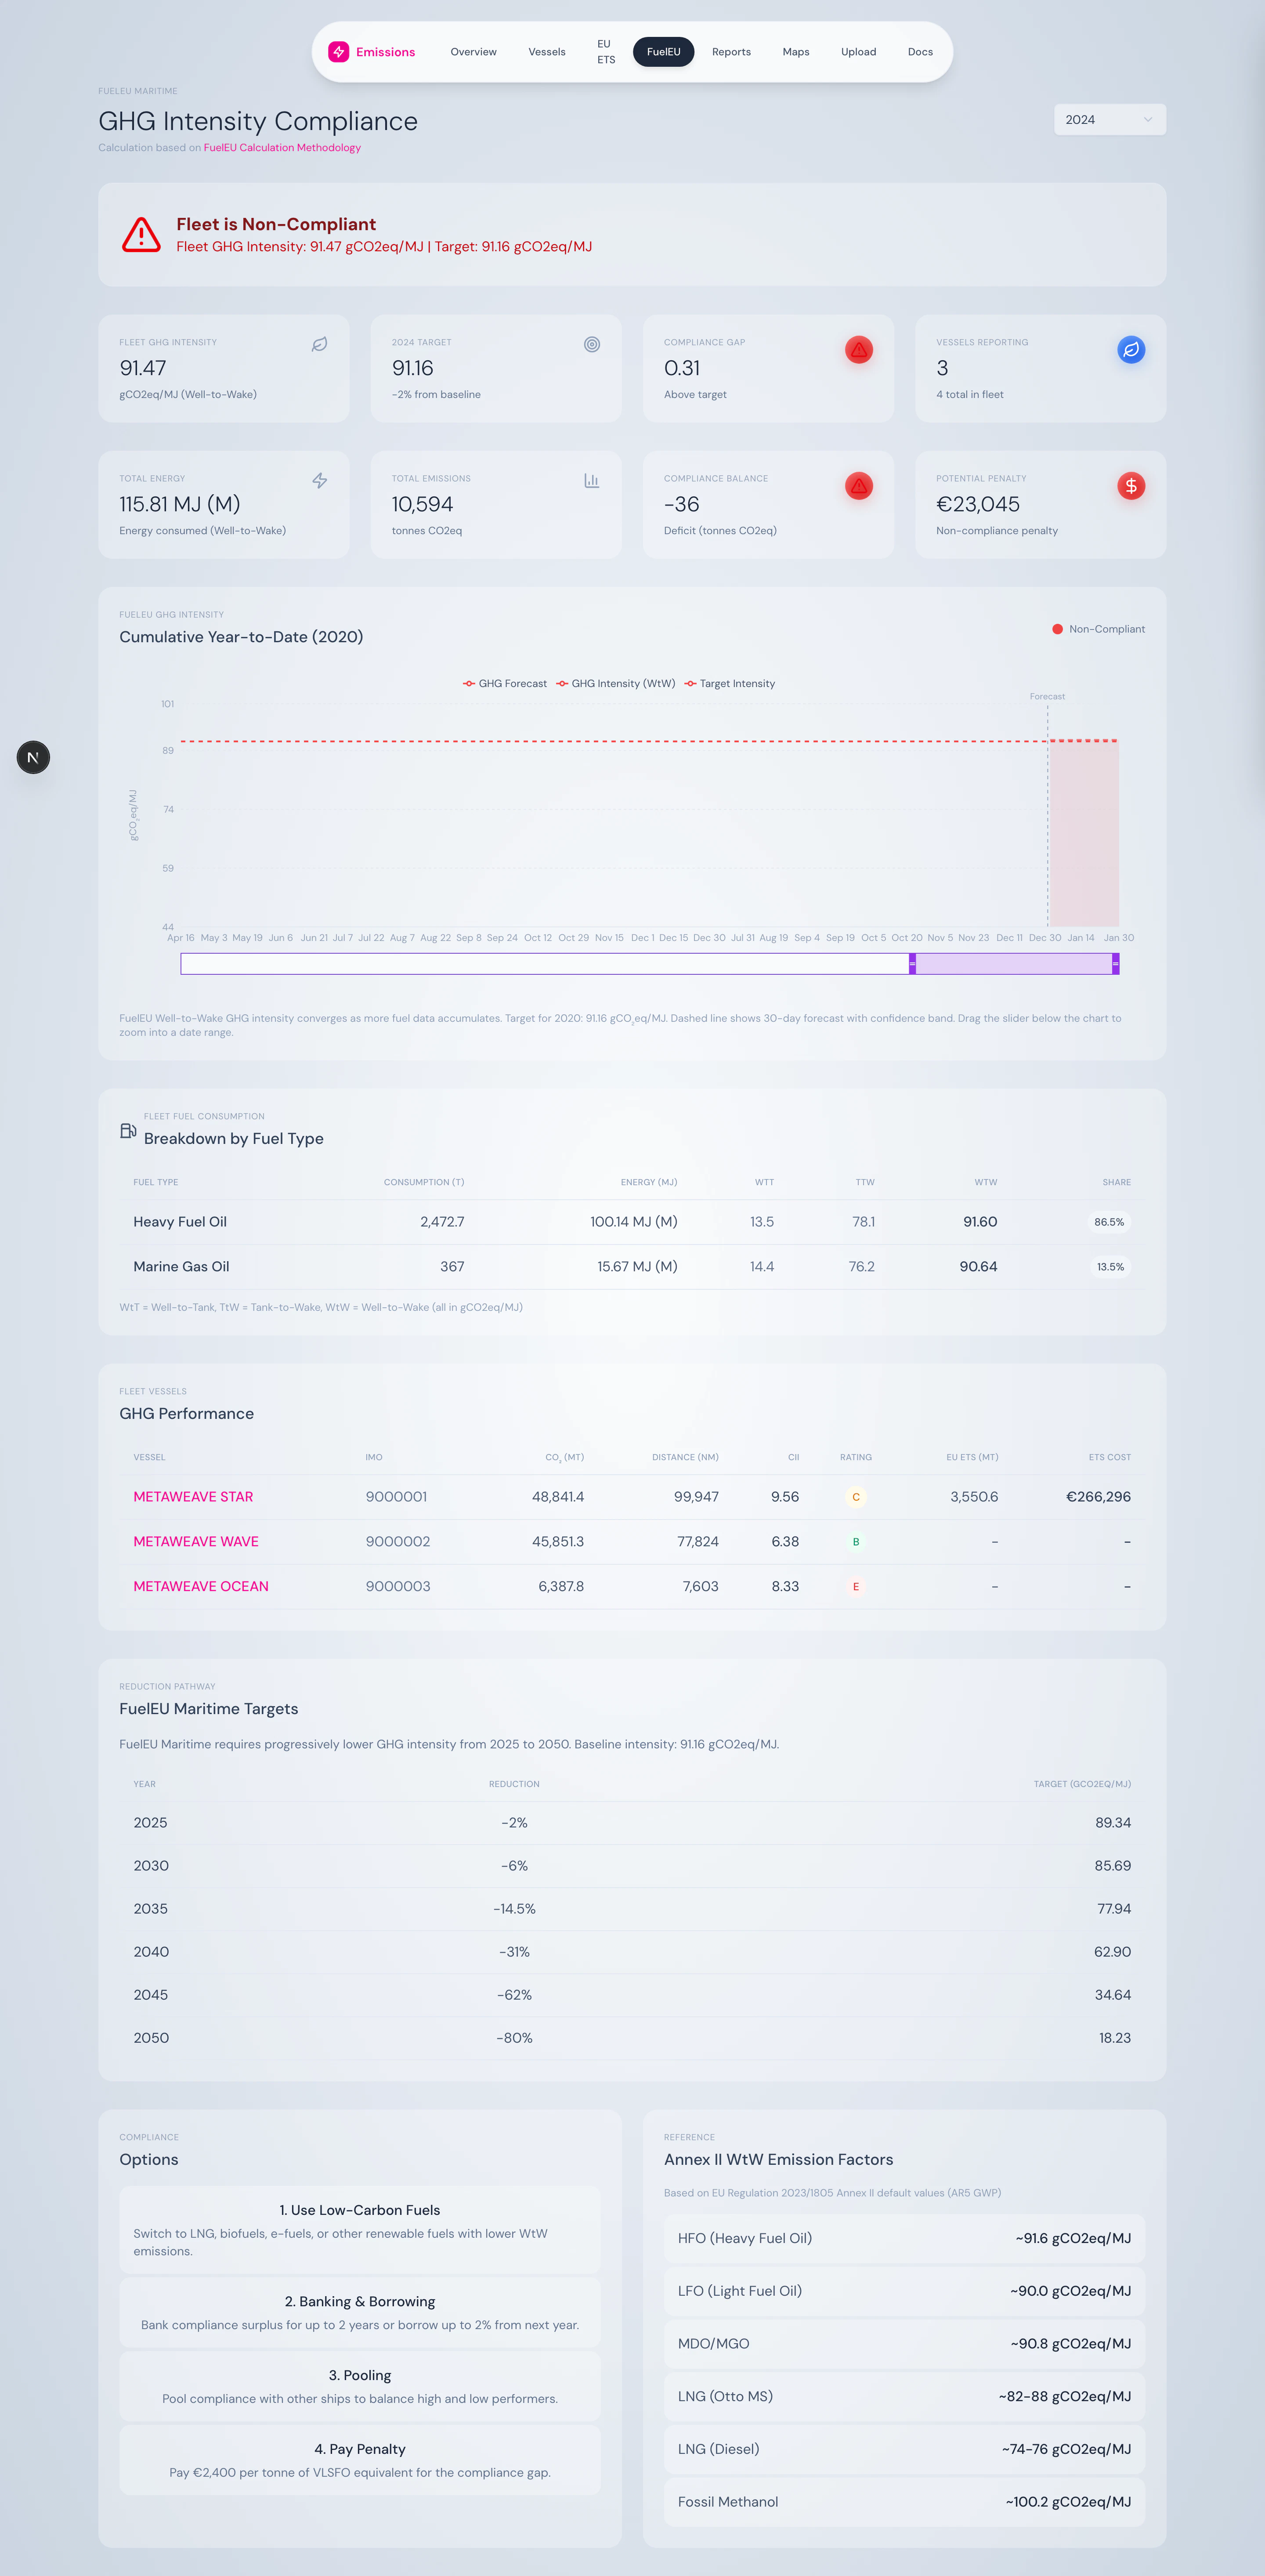 One row per fuel type in use:
| Column | Meaning |
| --------------- | ---------------------------------- |
| Fuel Type | HFO, MGO, LNG, Bio-Blend, etc. |
| Consumption (T) | Tonnes burned |
| Energy (MJ) | Tonnes × LCV |
| WtT | Well-to-Tank intensity (gCO₂eq/MJ) |
| TtW | Tank-to-Wake intensity (gCO₂eq/MJ) |
| WtW | Total = WtT + TtW |
| Share % | % of total fleet energy |
### Per-vessel ranking
One row per fuel type in use:
| Column | Meaning |
| --------------- | ---------------------------------- |
| Fuel Type | HFO, MGO, LNG, Bio-Blend, etc. |
| Consumption (T) | Tonnes burned |
| Energy (MJ) | Tonnes × LCV |
| WtT | Well-to-Tank intensity (gCO₂eq/MJ) |
| TtW | Tank-to-Wake intensity (gCO₂eq/MJ) |
| WtW | Total = WtT + TtW |
| Share % | % of total fleet energy |
### Per-vessel ranking
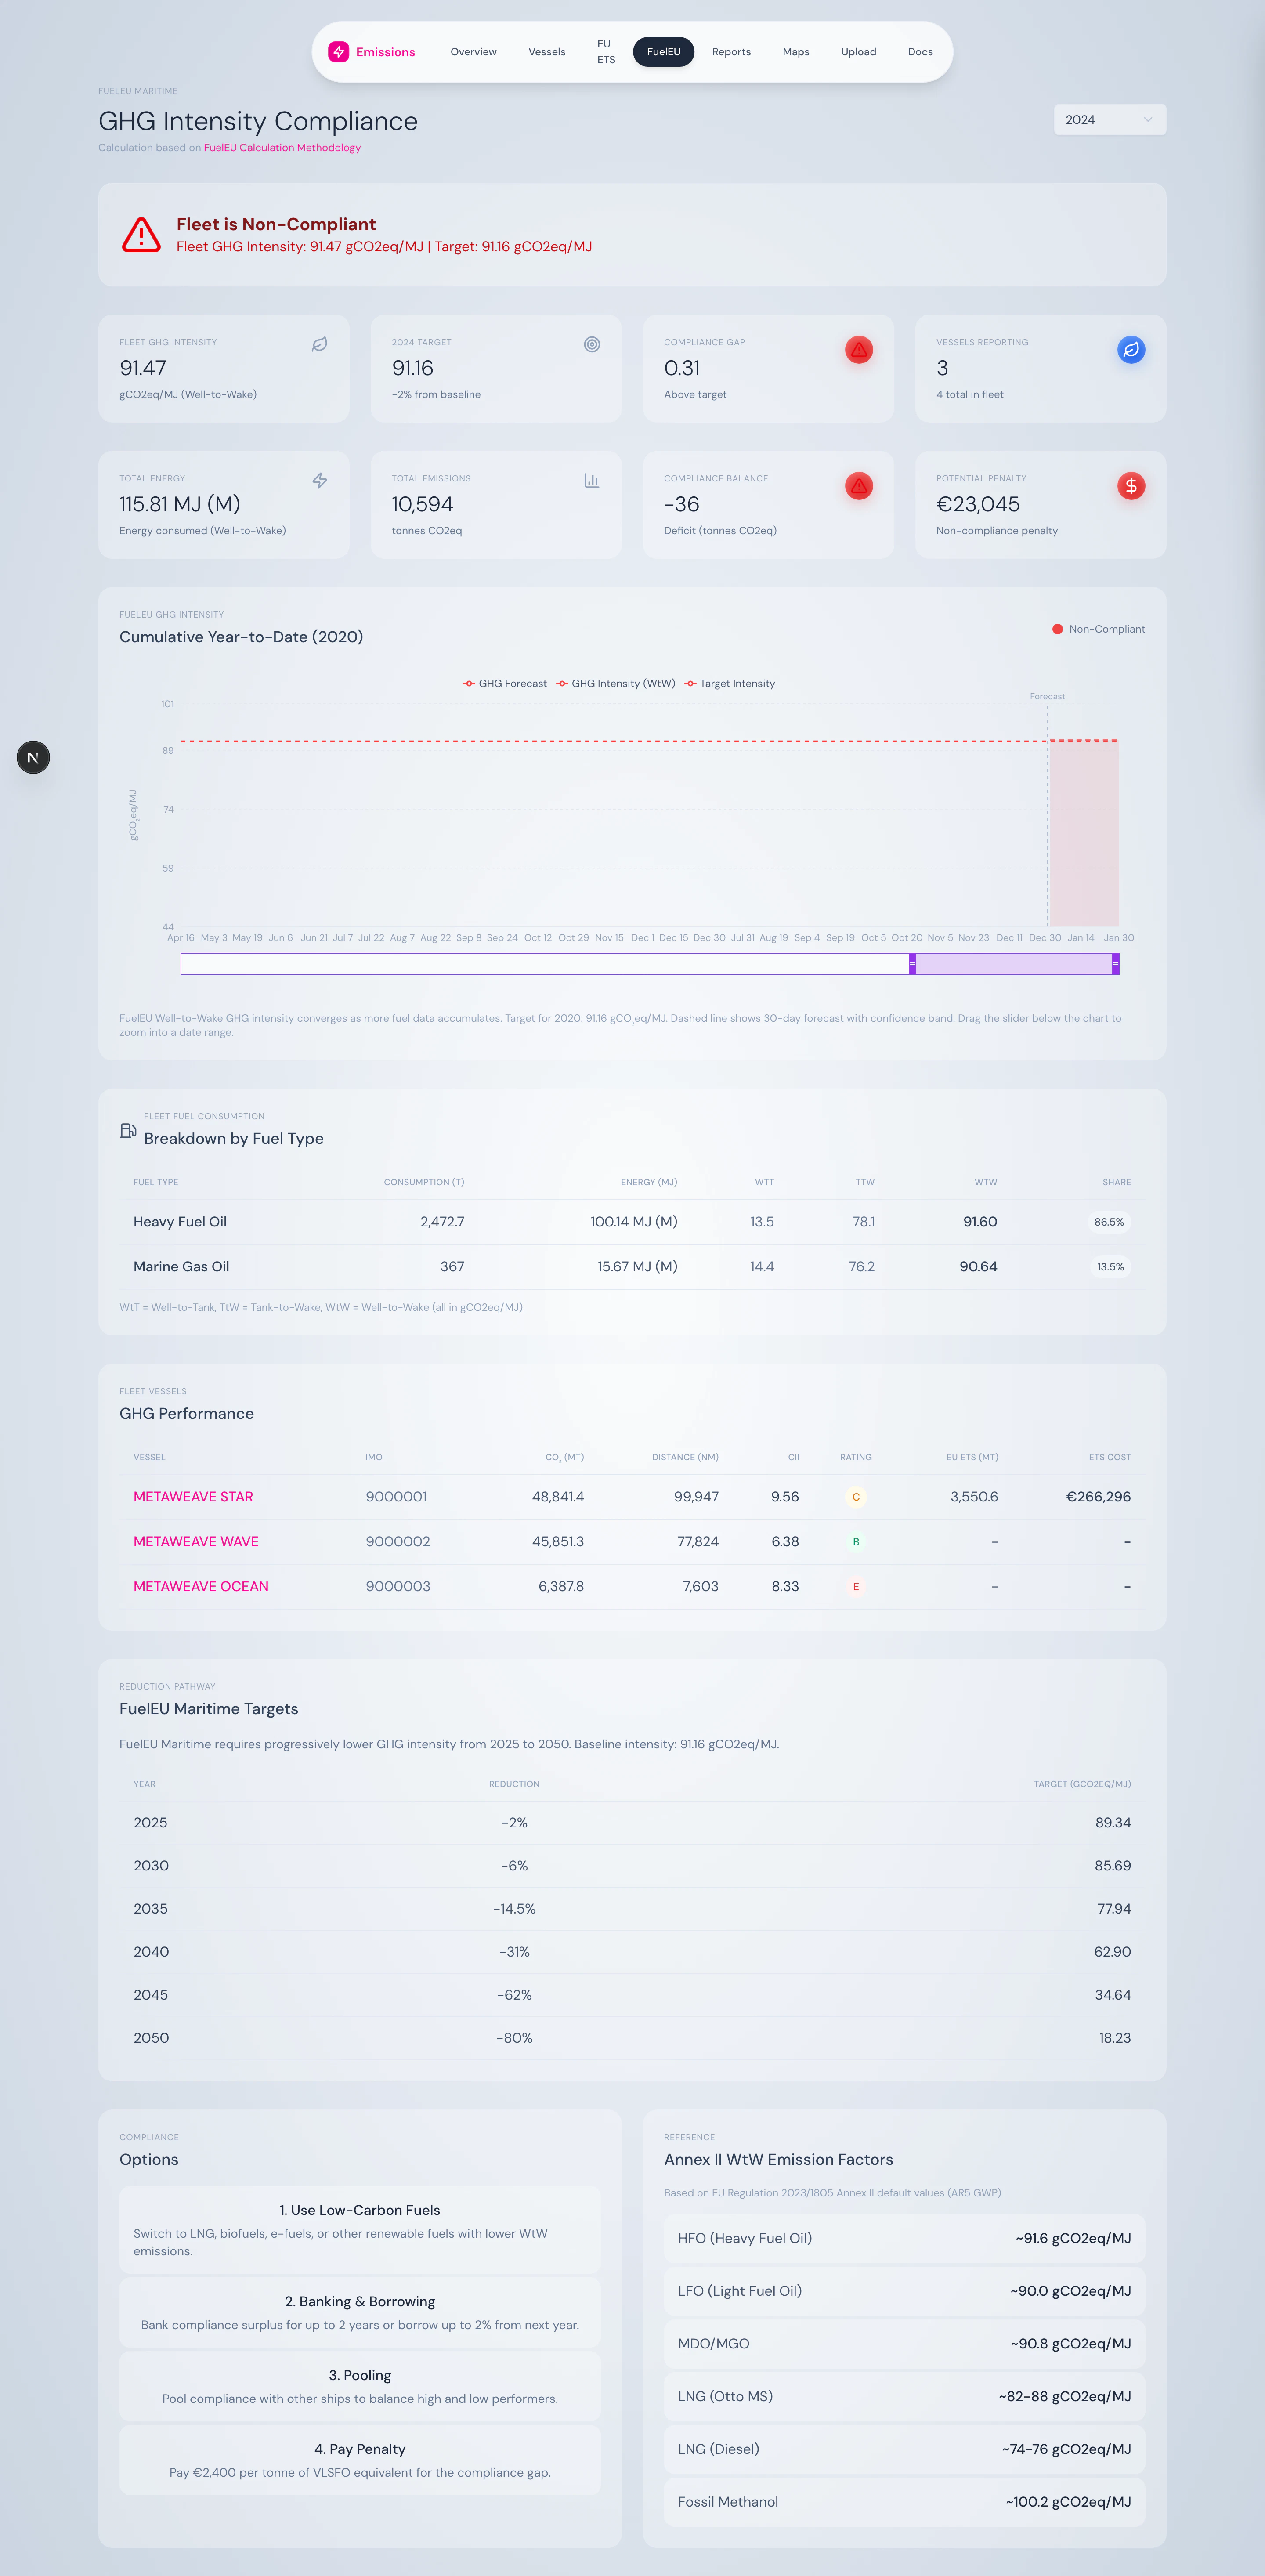 Which ships are pulling the fleet above target? This table ranks every vessel from lowest intensity to highest, with compliance badges for instant identification.
### Reduction pathway reference
Which ships are pulling the fleet above target? This table ranks every vessel from lowest intensity to highest, with compliance badges for instant identification.
### Reduction pathway reference
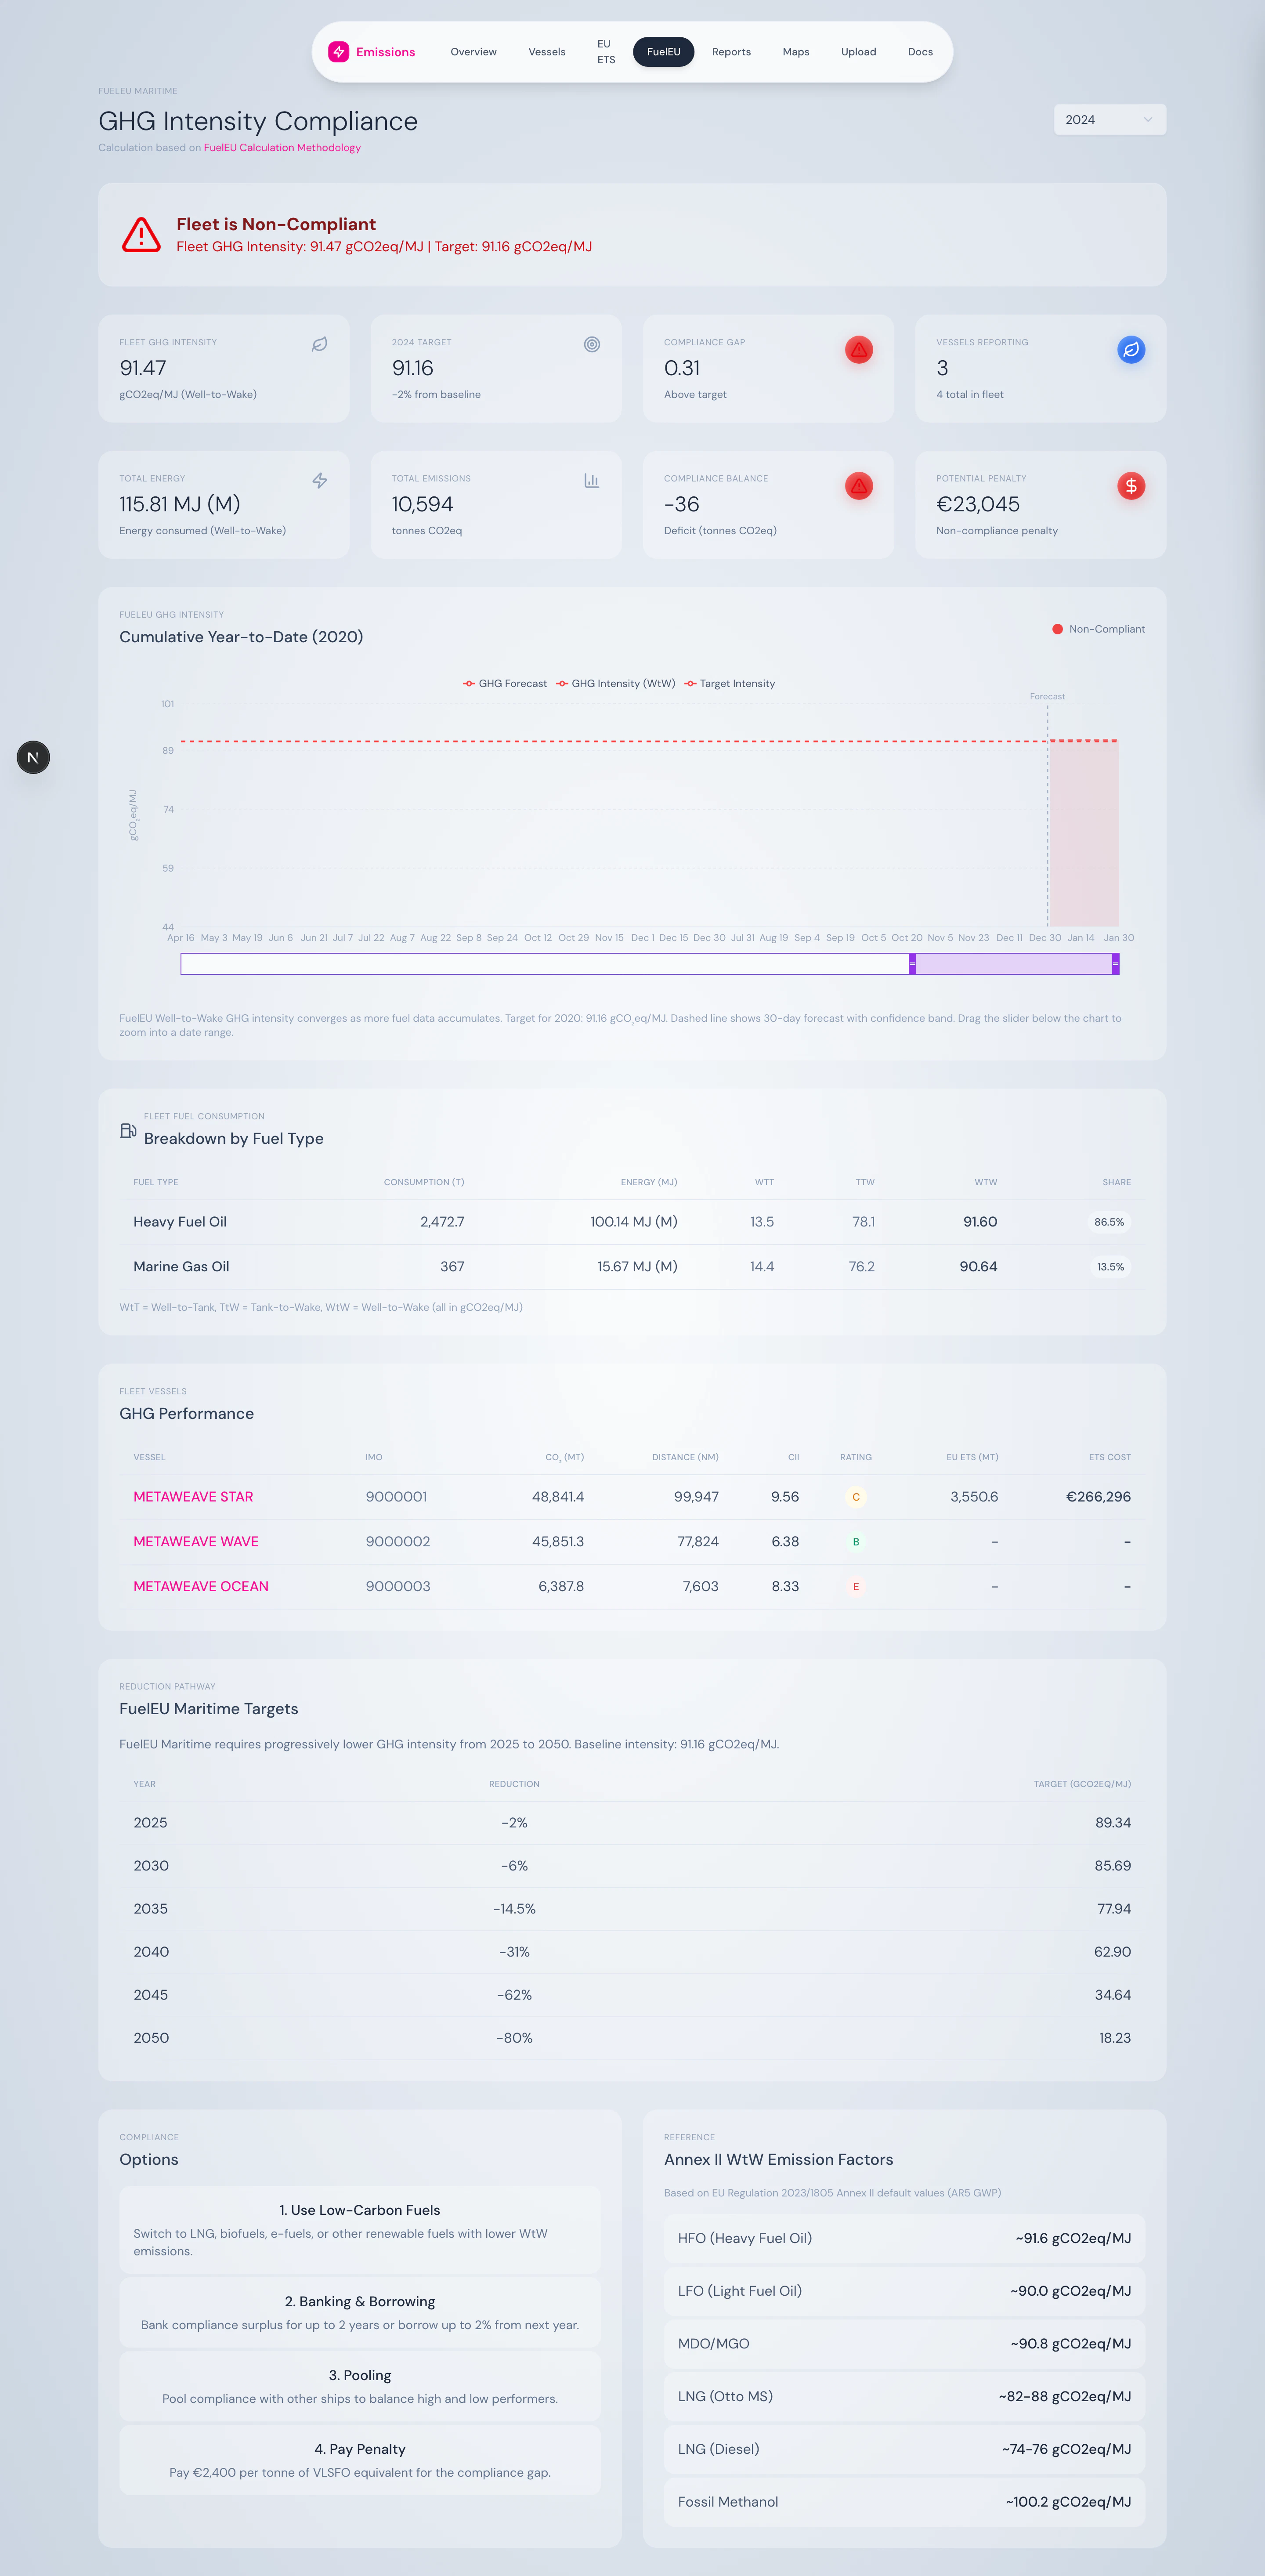 A static reference table showing the entire FuelEU trajectory through 2050 — useful for fleet-transition planning.
### Annex II factors reference
A second static reference table lists default WtT, TtW, and WtW values for every supported fuel — what the platform uses when no measured value is provided.
## What you can do here
* Track GHG intensity day-by-day across the year
* Identify which vessels and which fuels are dragging compliance down
* Model penalty exposure at current consumption levels
* Plan fleet transitions against the 2030 / 2035 / 2040 targets
* Generate the [FuelEU Maritime Report](/product/reports-hub) for verifier submission
## Source
Logic in `src/lib/utils/fuelEUCalculator.ts`. Hydrated from `FleetService.getFleetSummary()`.
A static reference table showing the entire FuelEU trajectory through 2050 — useful for fleet-transition planning.
### Annex II factors reference
A second static reference table lists default WtT, TtW, and WtW values for every supported fuel — what the platform uses when no measured value is provided.
## What you can do here
* Track GHG intensity day-by-day across the year
* Identify which vessels and which fuels are dragging compliance down
* Model penalty exposure at current consumption levels
* Plan fleet transitions against the 2030 / 2035 / 2040 targets
* Generate the [FuelEU Maritime Report](/product/reports-hub) for verifier submission
## Source
Logic in `src/lib/utils/fuelEUCalculator.ts`. Hydrated from `FleetService.getFleetSummary()`.