> ## Documentation Index
> Fetch the complete documentation index at: https://docs.appliedaifoundation.org/llms.txt
> Use this file to discover all available pages before exploring further.
# Fleet overview
> The home page — a single screen for fleet-wide CII, EU ETS, and FuelEU status.
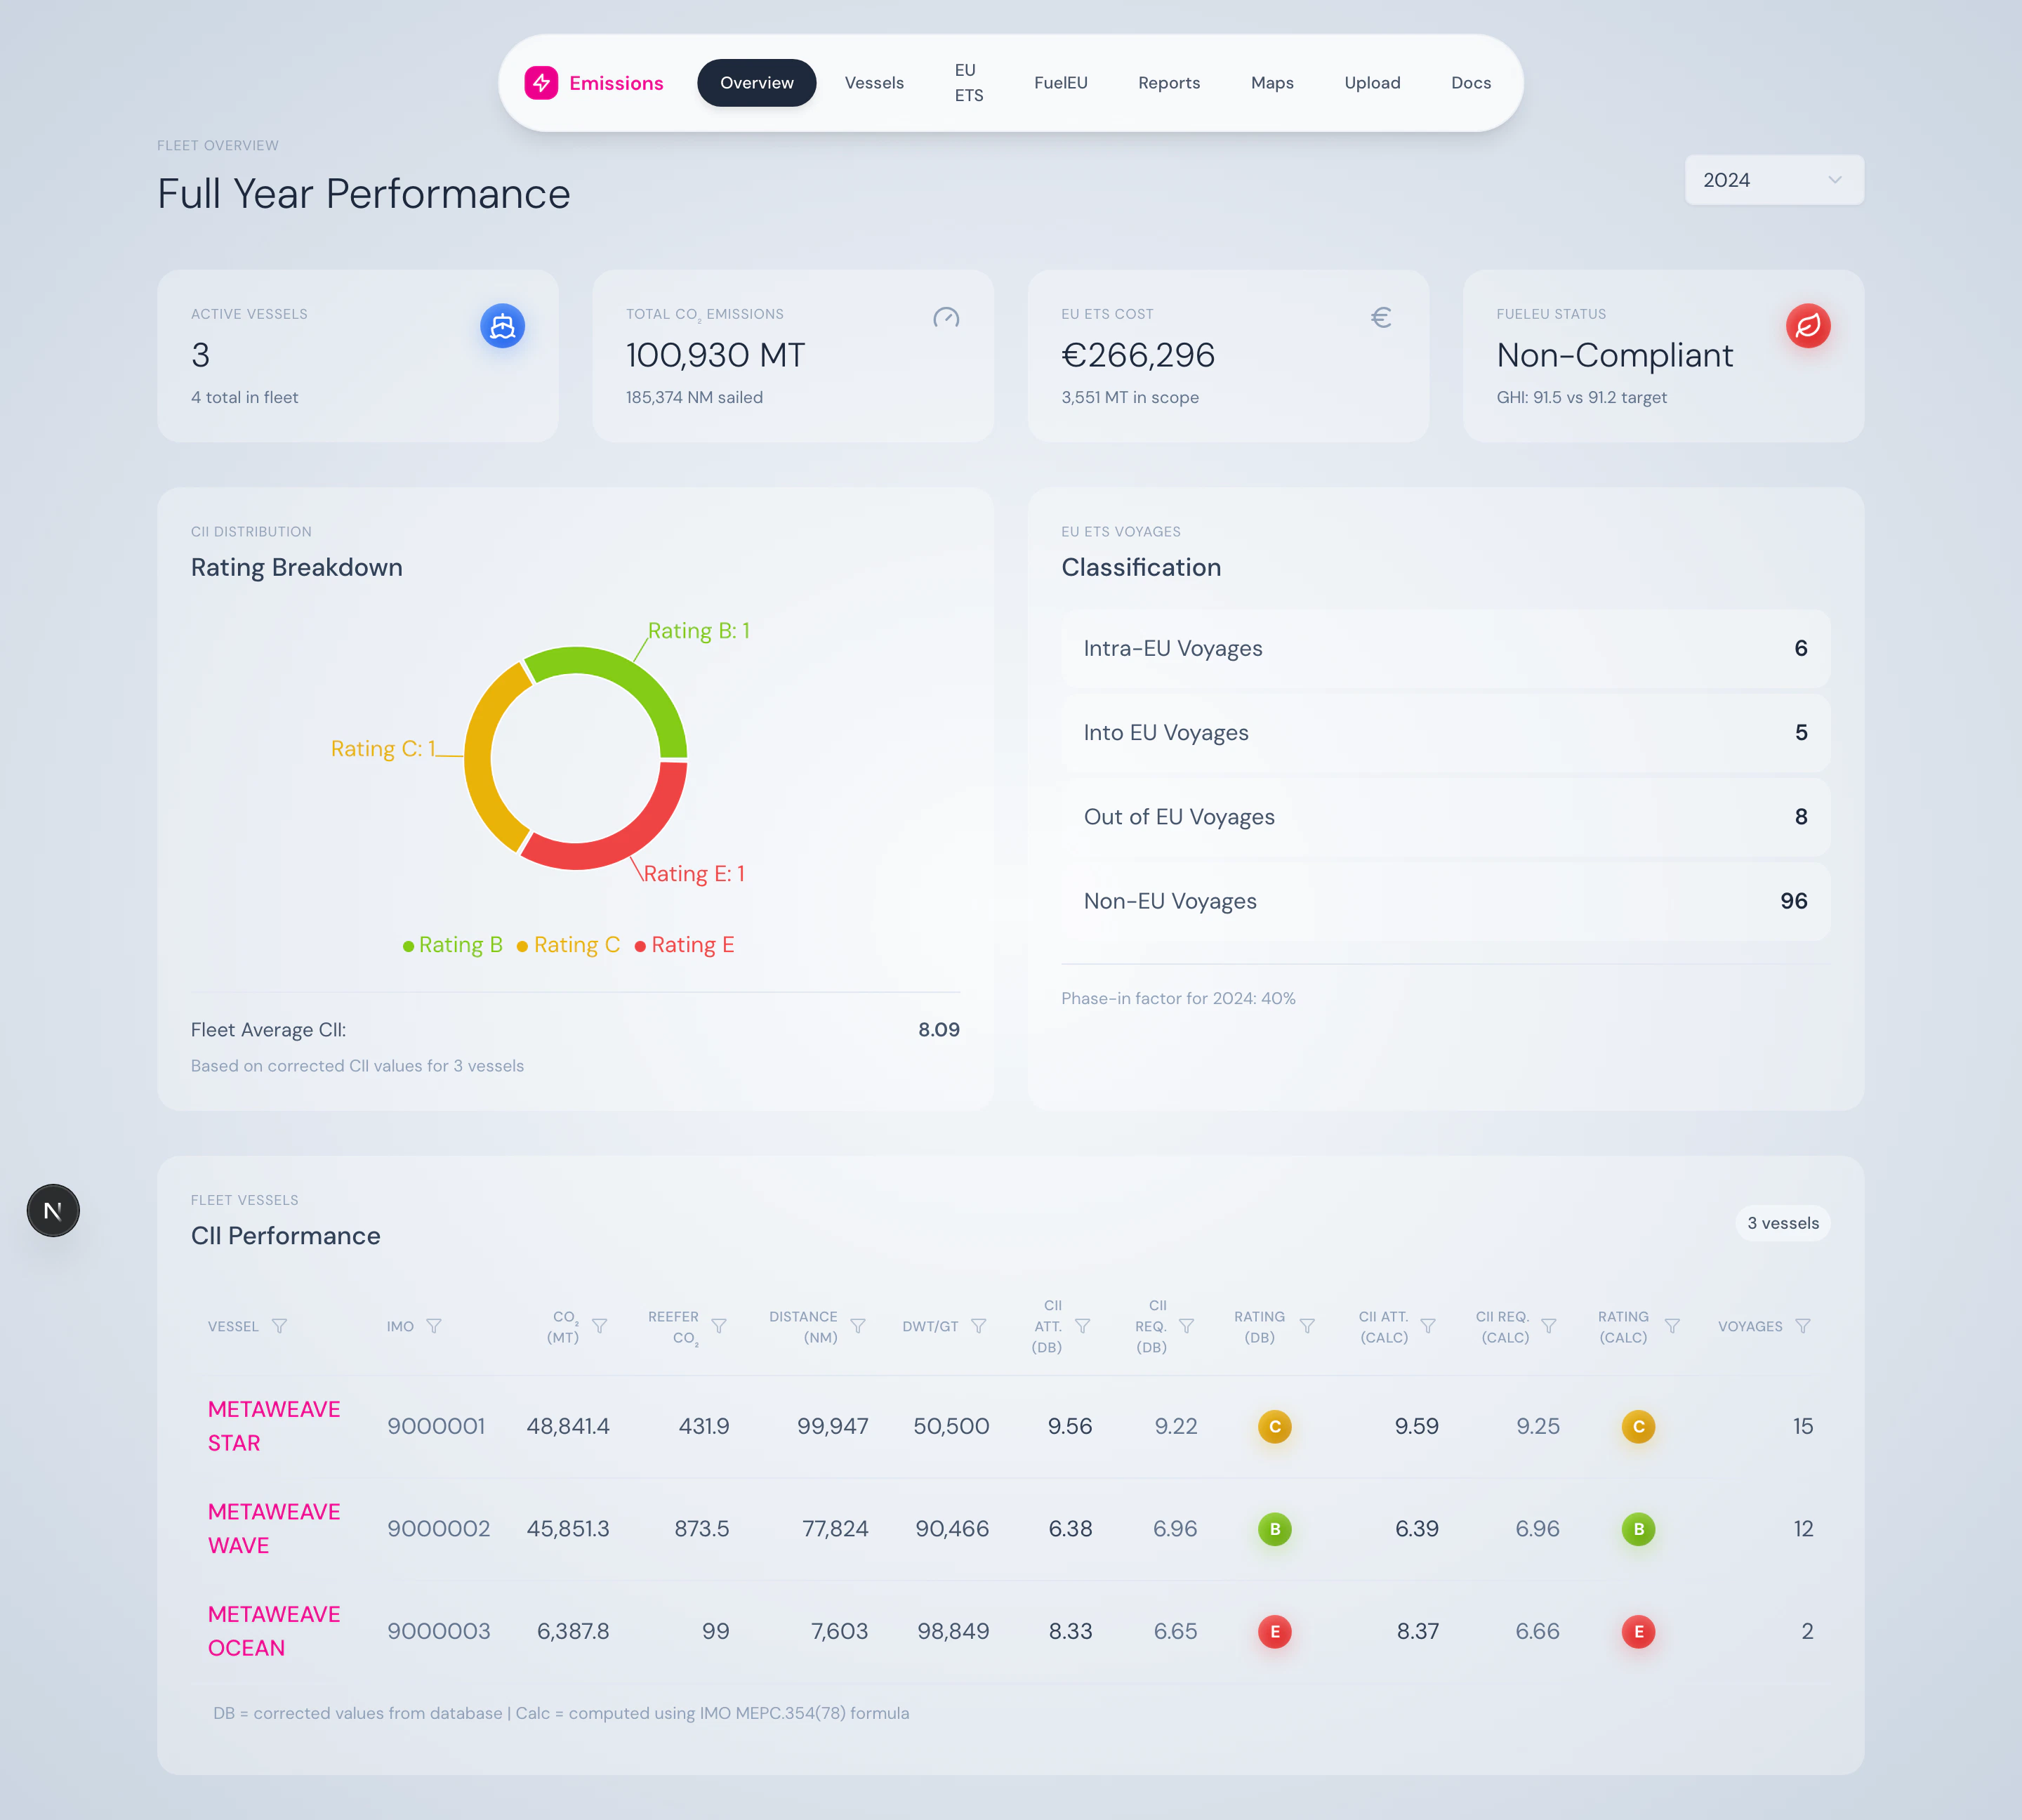
The fleet overview is the landing page. It answers the four questions a fleet manager has every Monday morning: how many vessels reported, what's our CO₂, what's our ETS bill so far, and are we FuelEU-compliant?
 ## What's on the page
### Year selector
A single dropdown drives everything. Pick any year that has data. For the current year, a **YTD** toggle restricts the data to year-to-date.
## What's on the page
### Year selector
A single dropdown drives everything. Pick any year that has data. For the current year, a **YTD** toggle restricts the data to year-to-date.
 ### Summary cards
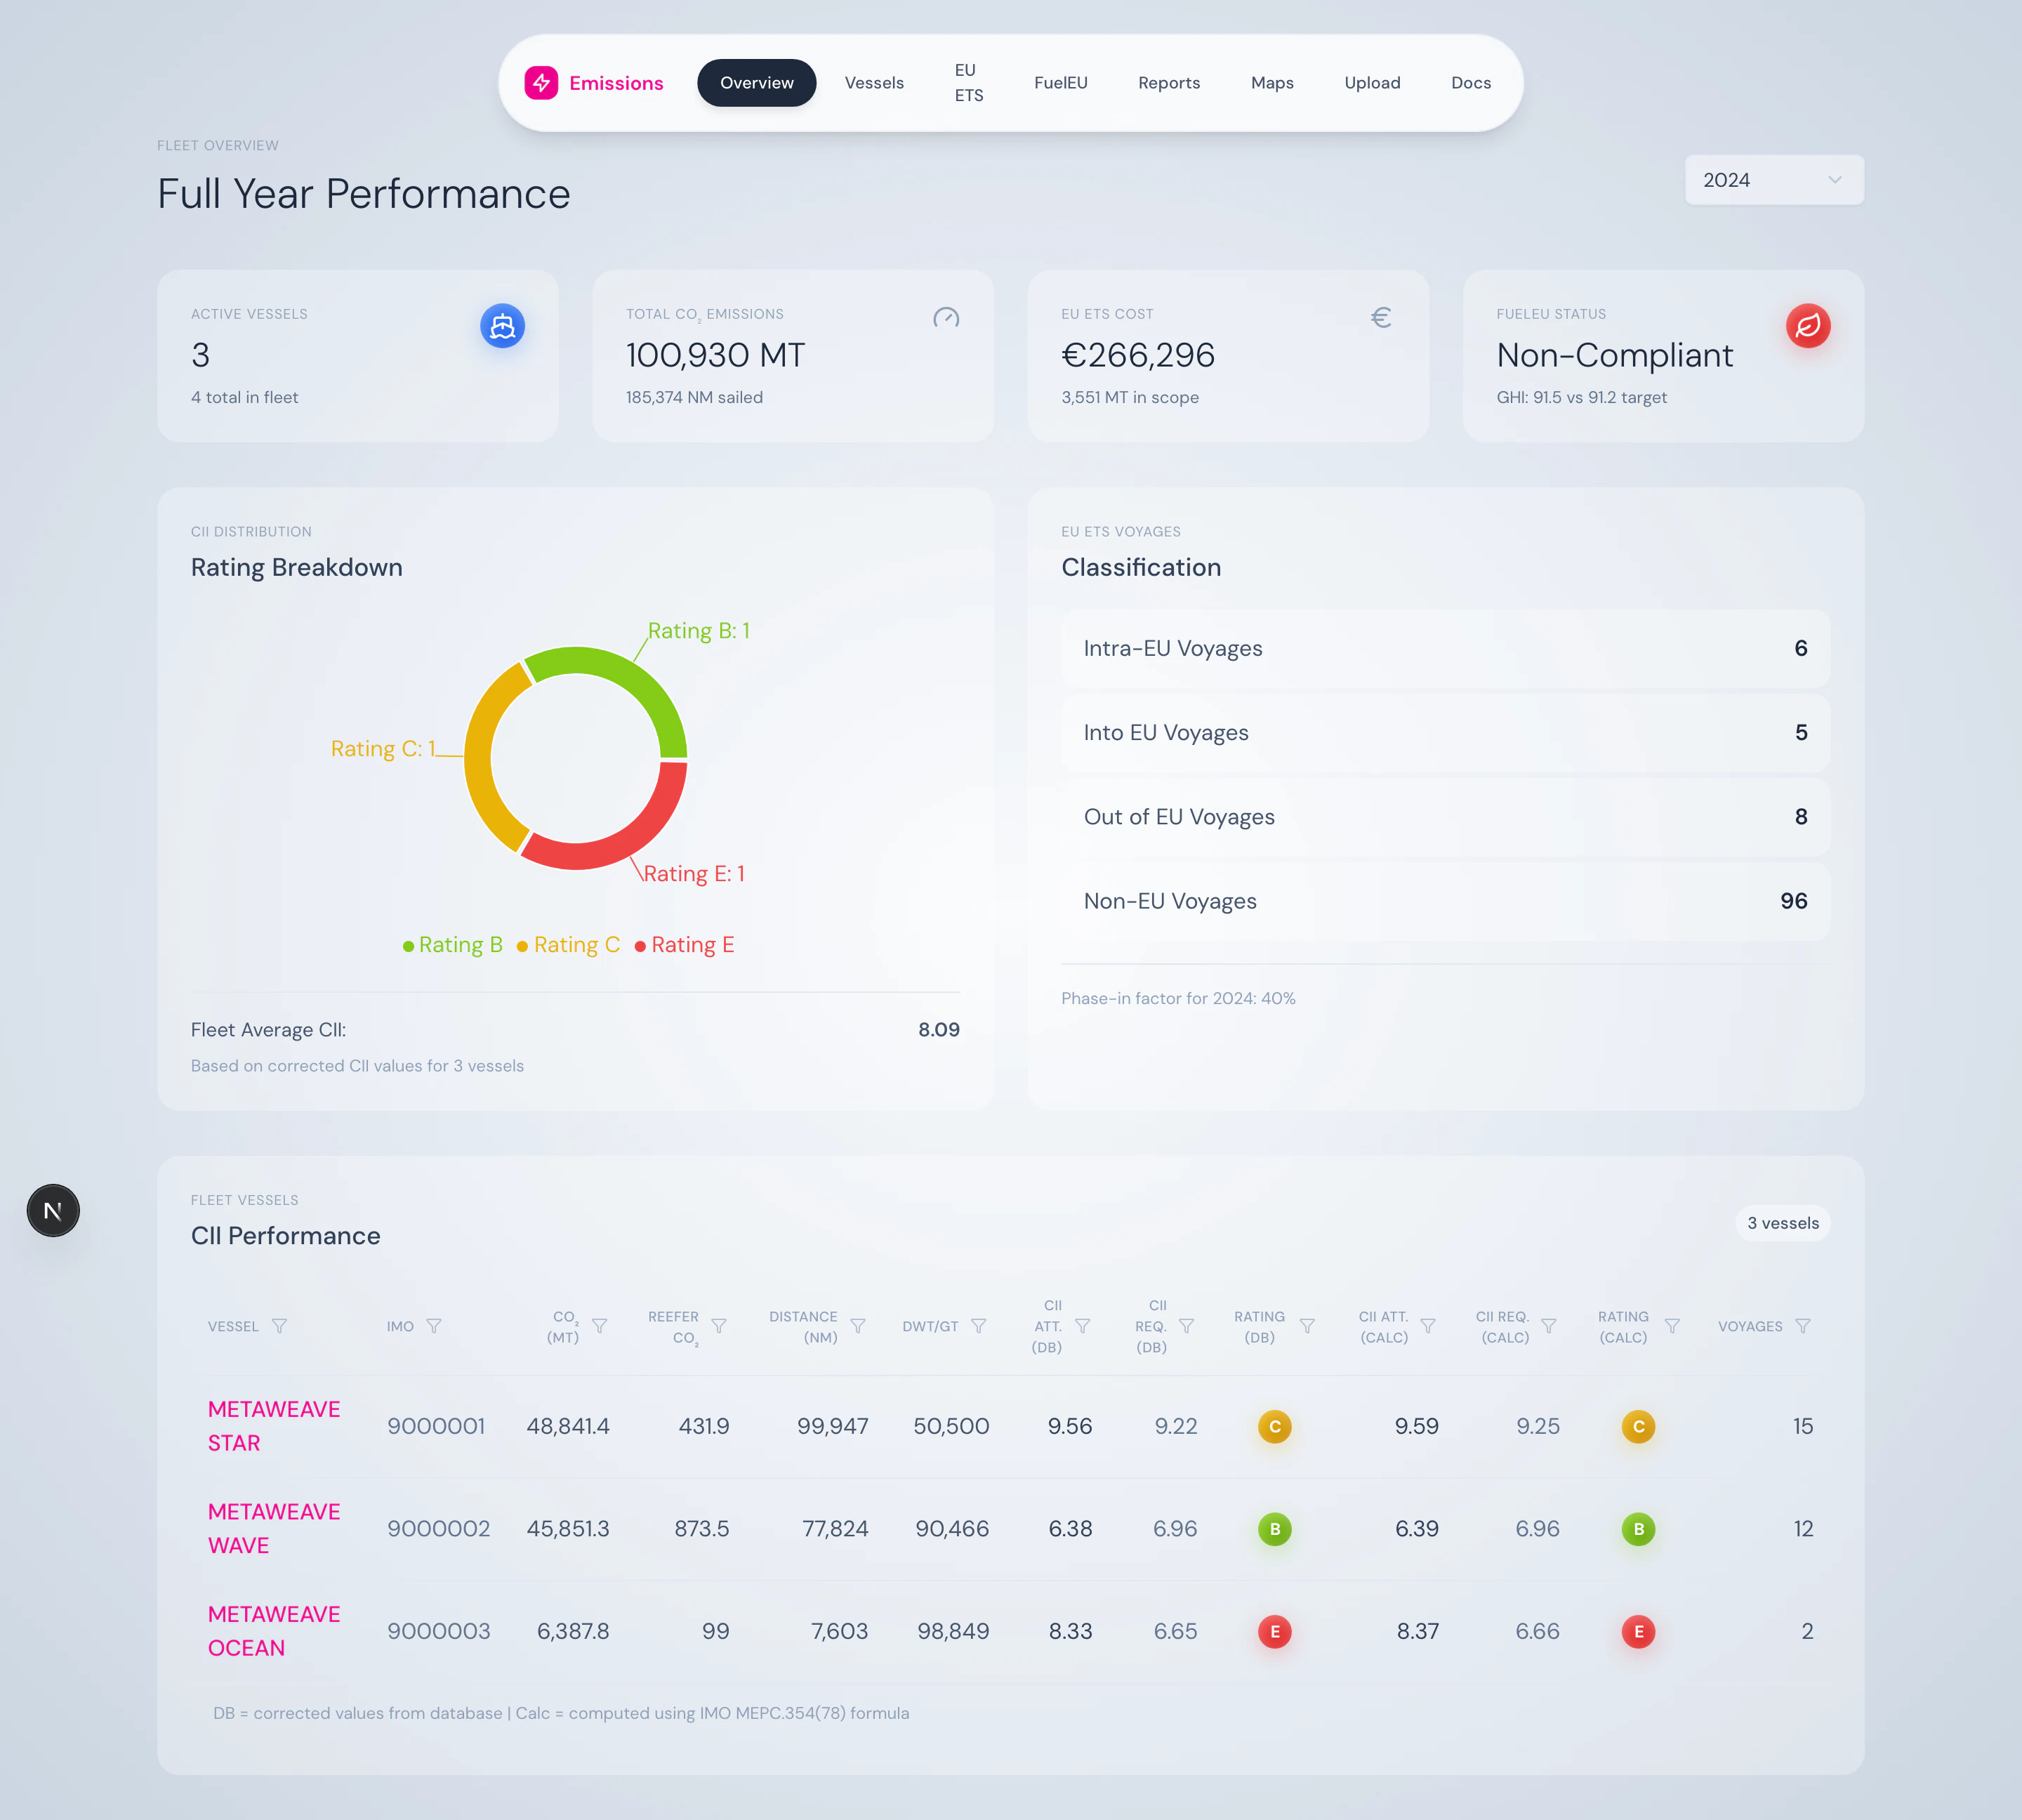
Four KPI cards across the top:
* **Active Vessels** — count of vessels with data, plus the total fleet size
* **Total CO₂ Emissions** — fleet-wide tonnes, plus distance sailed
* **EU ETS Total Cost** — projected cost in EUR, plus in-scope emissions
* **FuelEU Compliance Status** — Compliant / Non-Compliant, plus fleet GHI vs. target
### CII A–E distribution
A donut chart breaks the fleet down by rating band, with the fleet-average CII annotated in the centre. Hover any band to see the count of vessels in that band.
### Summary cards
Four KPI cards across the top:
* **Active Vessels** — count of vessels with data, plus the total fleet size
* **Total CO₂ Emissions** — fleet-wide tonnes, plus distance sailed
* **EU ETS Total Cost** — projected cost in EUR, plus in-scope emissions
* **FuelEU Compliance Status** — Compliant / Non-Compliant, plus fleet GHI vs. target
### CII A–E distribution
A donut chart breaks the fleet down by rating band, with the fleet-average CII annotated in the centre. Hover any band to see the count of vessels in that band.
 ### EU ETS voyages breakdown
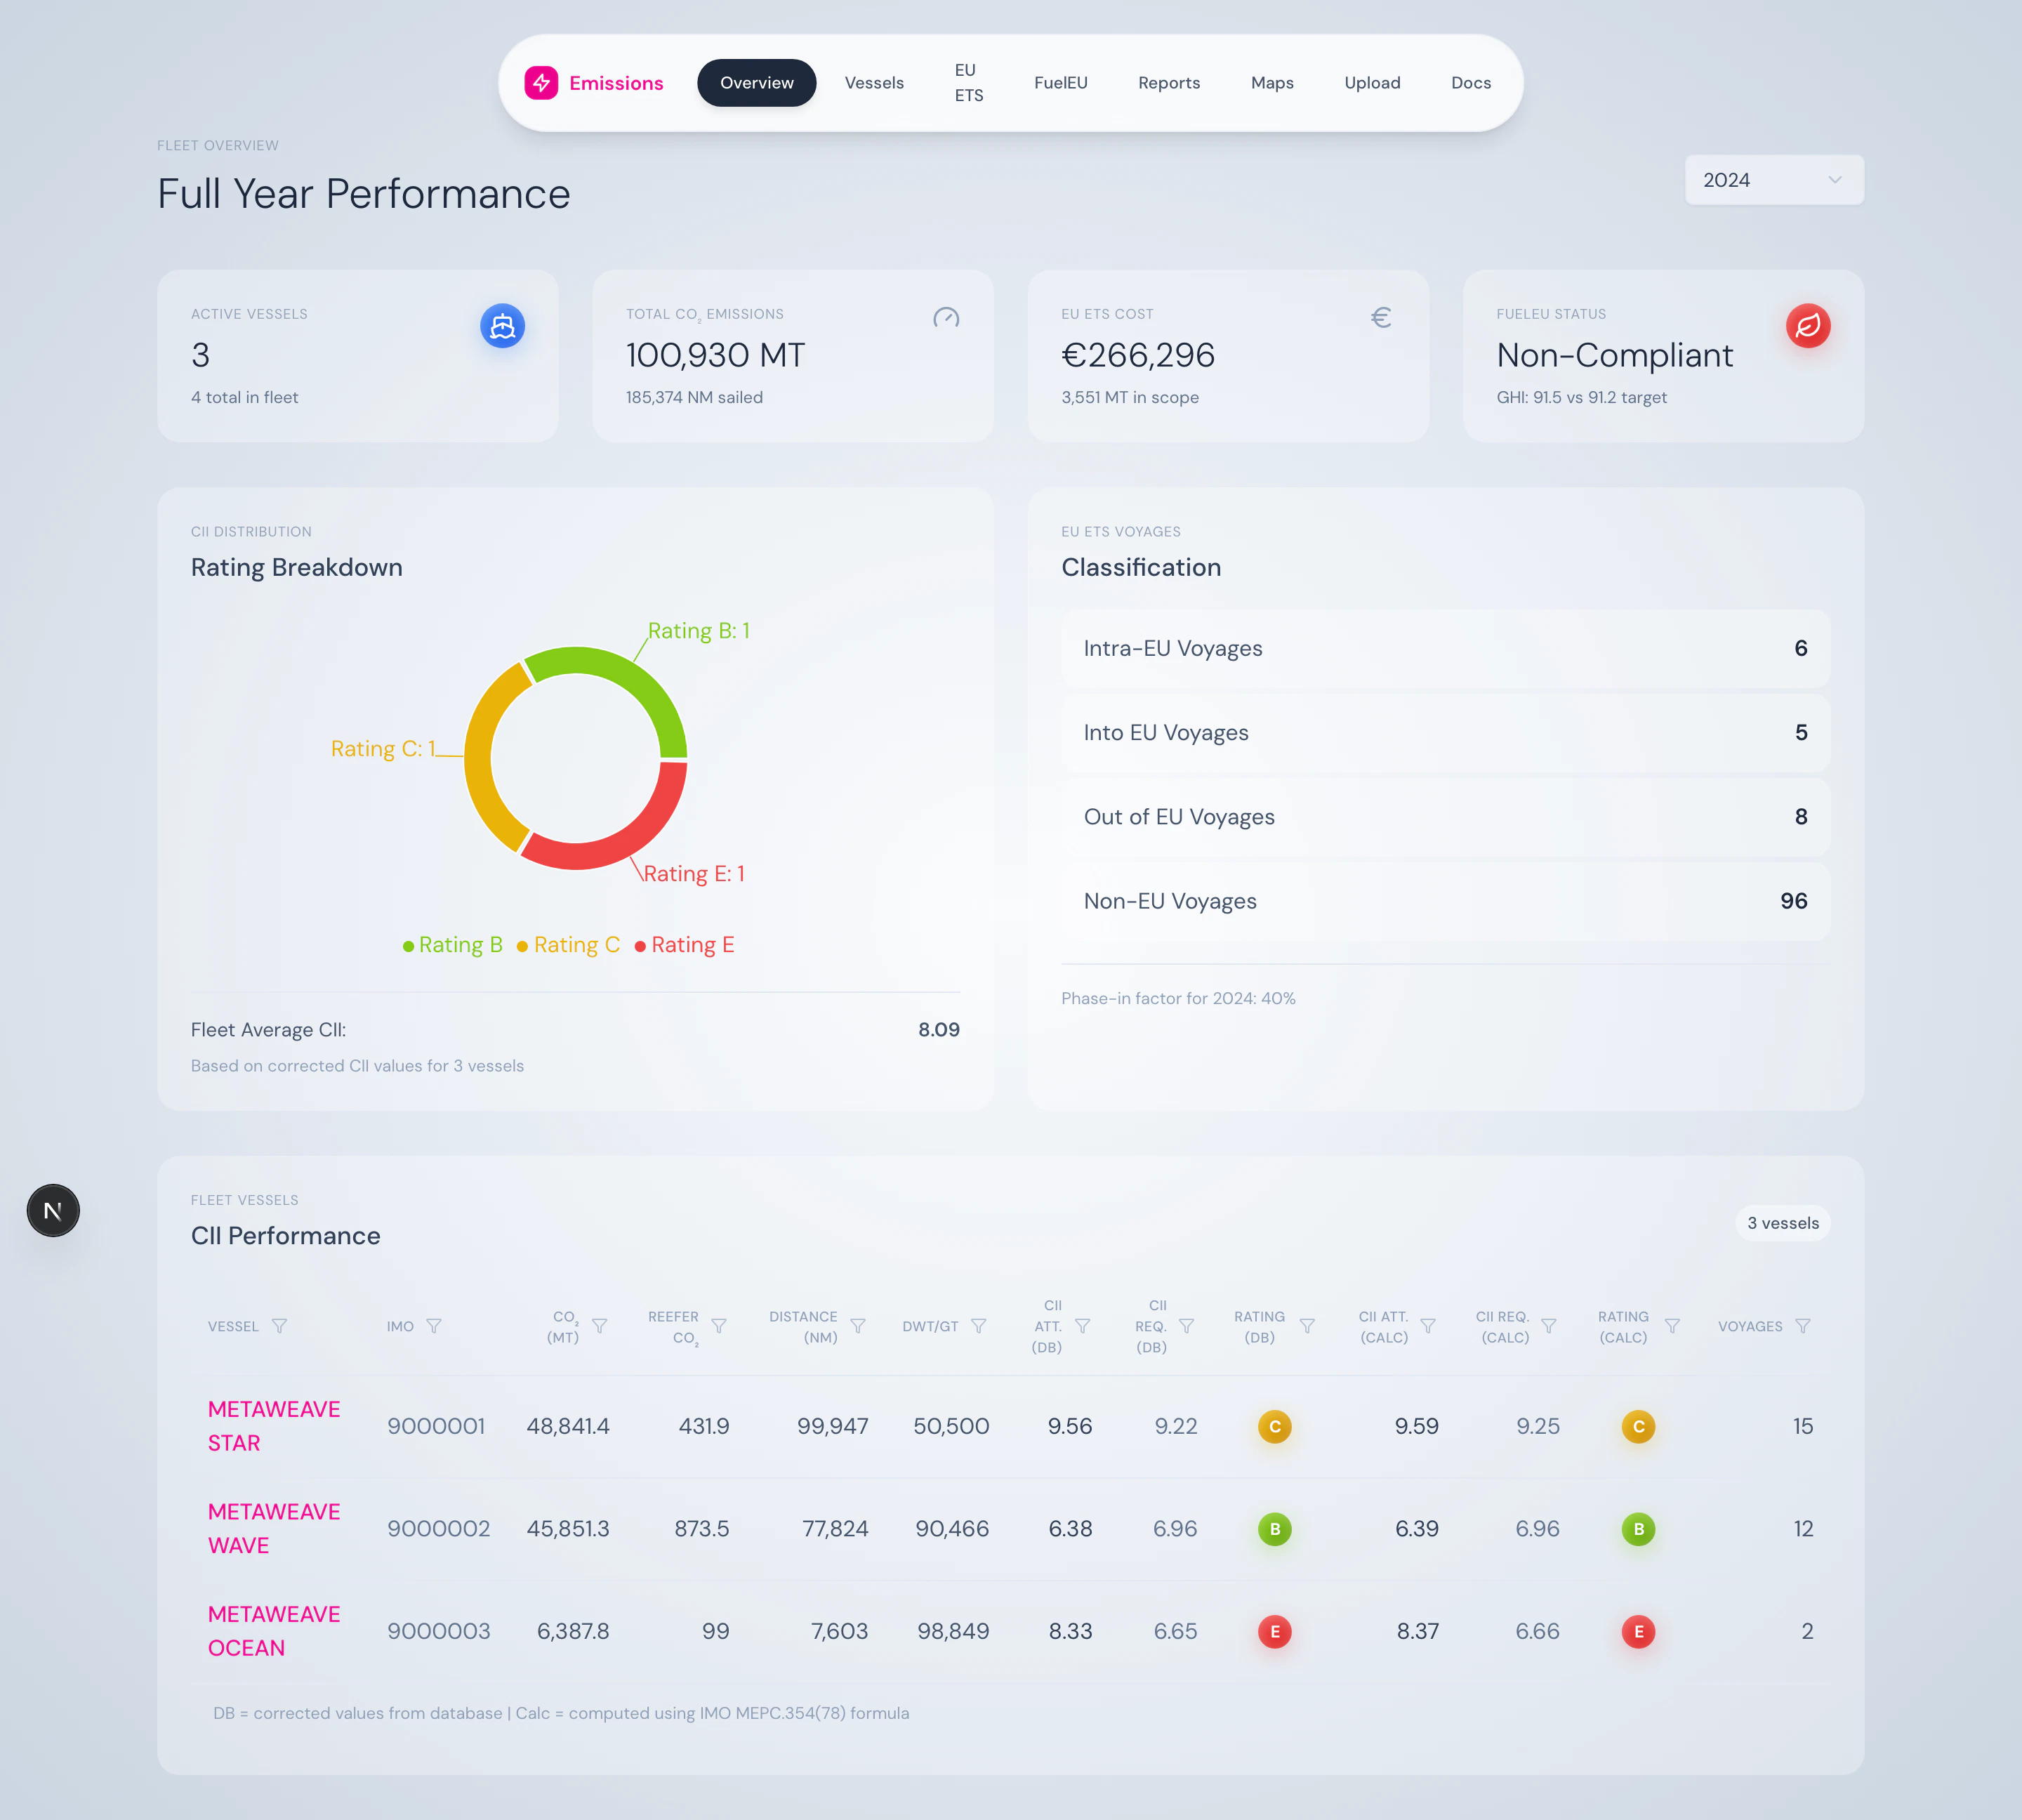
Counts of voyages by classification — Intra-EU, Into-EU, Out-of-EU, Non-EU — alongside the year's phase-in factor (40% in 2024, 70% in 2025, 100% from 2026).
### Fleet vessels table
A sortable, paginated table with one row per vessel:
* Vessel name + IMO
* CII attained / required / rating
* EU ETS cost
* FuelEU intensity + status
Click any row to drill into the [vessel detail page](/product/vessel-detail).
## What you can do here
* Compare fleet performance year-over-year by switching the year selector
* Spot underperforming vessels at a glance from the rating distribution
* Click into a vessel for a deep dive
* Project EU ETS cost with the configurable EUA price (set via `DEFAULT_EUA_PRICE`)
## Source
Powered by `/api/fleet/combined` and `/api/fleet/years`. The underlying business logic lives in `FleetService` (`src/lib/services/FleetService.ts`).
### EU ETS voyages breakdown
Counts of voyages by classification — Intra-EU, Into-EU, Out-of-EU, Non-EU — alongside the year's phase-in factor (40% in 2024, 70% in 2025, 100% from 2026).
### Fleet vessels table
A sortable, paginated table with one row per vessel:
* Vessel name + IMO
* CII attained / required / rating
* EU ETS cost
* FuelEU intensity + status
Click any row to drill into the [vessel detail page](/product/vessel-detail).
## What you can do here
* Compare fleet performance year-over-year by switching the year selector
* Spot underperforming vessels at a glance from the rating distribution
* Click into a vessel for a deep dive
* Project EU ETS cost with the configurable EUA price (set via `DEFAULT_EUA_PRICE`)
## Source
Powered by `/api/fleet/combined` and `/api/fleet/years`. The underlying business logic lives in `FleetService` (`src/lib/services/FleetService.ts`).