> ## Documentation Index
> Fetch the complete documentation index at: https://docs.appliedaifoundation.org/llms.txt
> Use this file to discover all available pages before exploring further.
# Overview Tab
> Real-time system status via the central 16-lamp diamond array and surrounding metric panels.
 ## Layout philosophy
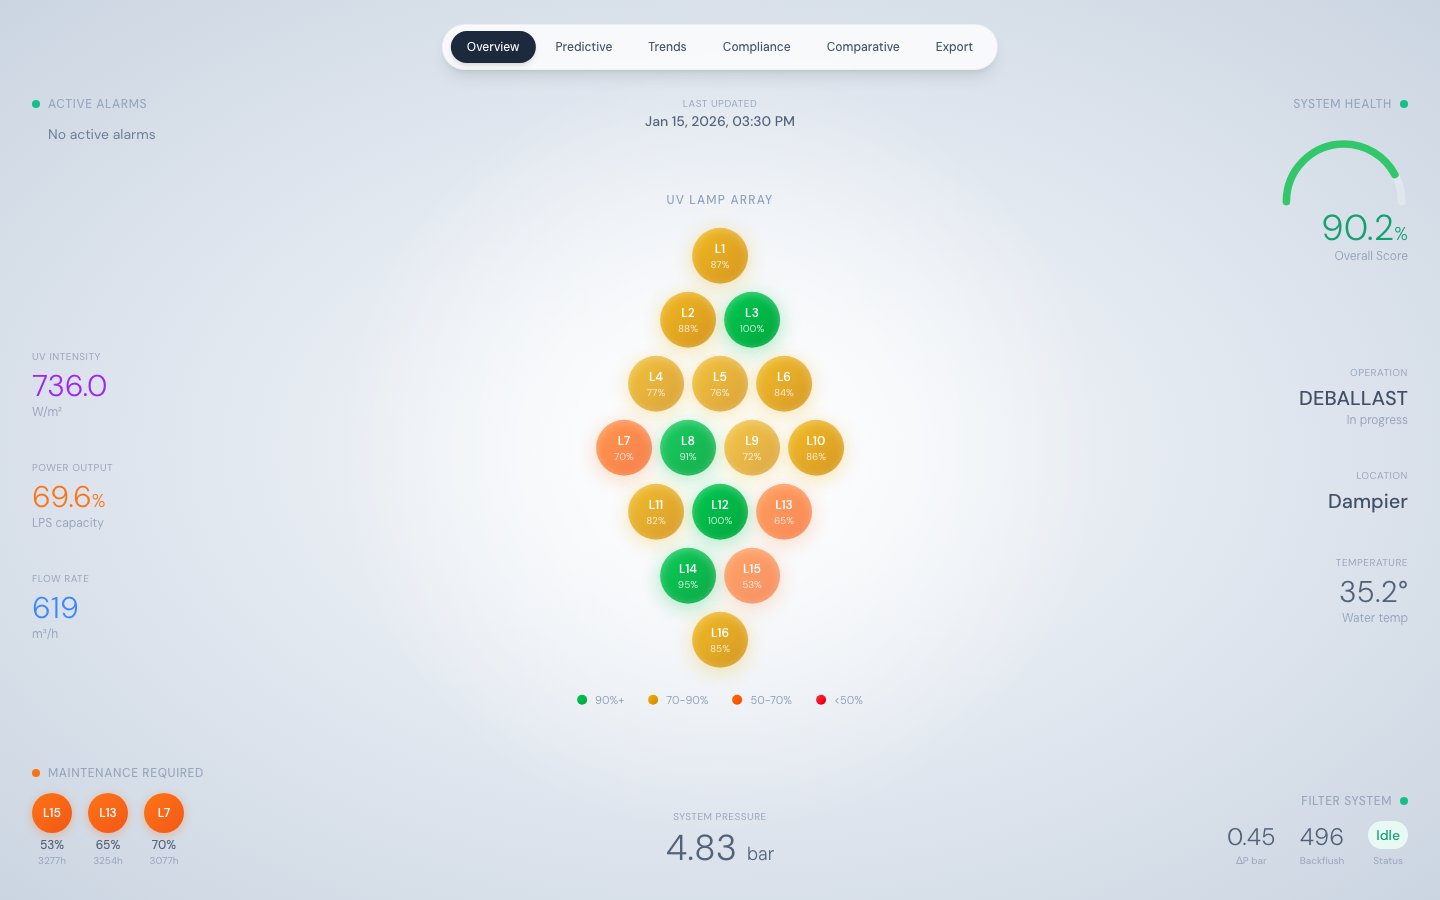
The Overview tab uses a **radial "gravitational" design** — the 16-lamp diamond array occupies the centre of the screen as the primary focal point, and all supporting metrics float at the edges. There are no card borders or containers; typography hierarchy and spacing replace visual dividers. The background is a radial gradient from light slate to medium slate.
Data is fetched from `/api/stats` and auto-refreshes every 30 seconds.
## The diamond lamp array
## Layout philosophy
The Overview tab uses a **radial "gravitational" design** — the 16-lamp diamond array occupies the centre of the screen as the primary focal point, and all supporting metrics float at the edges. There are no card borders or containers; typography hierarchy and spacing replace visual dividers. The background is a radial gradient from light slate to medium slate.
Data is fetched from `/api/stats` and auto-refreshes every 30 seconds.
## The diamond lamp array
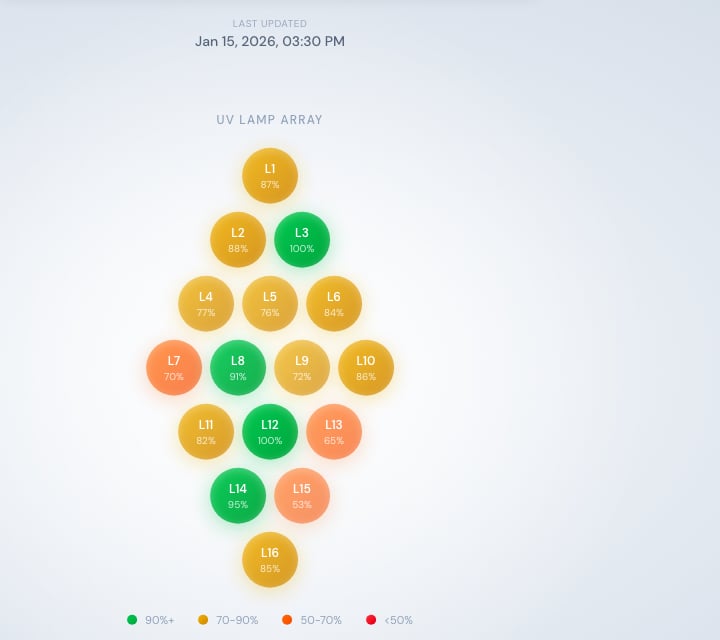 The 16 UV lamps are arranged in a diamond pattern (rows: 1-2-3-4-3-2-1). Each lamp circle shows:
* **Lamp number** — L01 through L16
* **Efficiency percentage** — the current `LAMP_XX_EFFICIENCY` value
* **Colour** — coded by efficiency tier (see table below)
* **Opacity** — scales with efficiency, providing an immediate at-a-glance scan
Hover over any lamp circle to see a tooltip with exact efficiency, runtime hours, and operational status.
### Lamp colour coding
| Colour | Efficiency | Meaning |
| ------ | ---------------- | ------------------------------------------- |
| Green | ≥ 90% | Excellent — nominal operation |
| Yellow | 70–89% | Good — monitor, plan future replacement |
| Orange | 50–69% | Warning — schedule replacement at next port |
| Red | \< 50% or FAILED | Critical — urgent attention required |
## Metric panels
### Top-left: Active Alarms
Displays the last 3 `ALARM_TRIGGERED` events from the event feed. An animated amber dot appears when any alarm is present. Each entry shows the event description and timestamp. Source: `/api/stats → recentEvents`.
### Top-right: System Health Gauge
An SVG arc gauge showing the `overall_score` (0–100) from the latest health record. The colour of the gauge arc changes with the score:
| Score | Gauge colour |
| ----- | ------------ |
| ≥ 80 | Green |
| 60–79 | Blue |
| 40–59 | Orange |
| \< 40 | Red |
### Left side: UV and power metrics
| Metric | Field | Unit |
| ------------ | ------------------ | ------------------- |
| UV Intensity | `UVR_INTENSITY` | W/m² |
| Power Output | `UVR_POWER_OUTPUT` | % of rated capacity |
| Flow Rate | `SYS_FLOW_RATE` | m³/h |
### Right side: Operational context
| Metric | Field | Description |
| ----------------- | ---------------- | -------------------- |
| Operation Type | `operation_type` | BALLAST or DEBALLAST |
| Location | `location` | Current port name |
| Water Temperature | `UVR_WATER_TEMP` | °C |
### Bottom-left: Maintenance Required
Lists up to three lamps with efficiency below 75% or runtime above 2,500 hours, sorted by lowest efficiency first. This provides an at-a-glance maintenance priority list without navigating to the Predictive Maintenance tab.
### Bottom-center: System Pressure
Displays `SYS_PRESSURE` in bar.
### Bottom-right: Filter System
| Metric | Field |
| ----------------------- | ------------------------- |
| Differential pressure | `FLT_DIFF_PRESSURE` (bar) |
| Backflush cycle count | `FLT_BACKFLUSH_COUNT` |
| Backflush active status | `FLT_BACKFLUSH_ACTIVE` |
## What you can do here
* Get an immediate read on system health without navigating any menus
* Spot failing or degraded lamps instantly by scanning the diamond for red or orange circles
* Check whether UV intensity is above the IMO (252 W/m²) or USCG (530 W/m²) compliance threshold
* See recent alarms and their timestamps
* Monitor filter backflush activity which can indicate water quality issues
## Source
Data is served by `/api/stats`, which runs four parallel database queries and returns `latestTelemetry`, `latestHealth`, `recentEvents`, and `monthlyAvg` in a single response. This keeps the Overview tab to a single HTTP round-trip.
The 16 UV lamps are arranged in a diamond pattern (rows: 1-2-3-4-3-2-1). Each lamp circle shows:
* **Lamp number** — L01 through L16
* **Efficiency percentage** — the current `LAMP_XX_EFFICIENCY` value
* **Colour** — coded by efficiency tier (see table below)
* **Opacity** — scales with efficiency, providing an immediate at-a-glance scan
Hover over any lamp circle to see a tooltip with exact efficiency, runtime hours, and operational status.
### Lamp colour coding
| Colour | Efficiency | Meaning |
| ------ | ---------------- | ------------------------------------------- |
| Green | ≥ 90% | Excellent — nominal operation |
| Yellow | 70–89% | Good — monitor, plan future replacement |
| Orange | 50–69% | Warning — schedule replacement at next port |
| Red | \< 50% or FAILED | Critical — urgent attention required |
## Metric panels
### Top-left: Active Alarms
Displays the last 3 `ALARM_TRIGGERED` events from the event feed. An animated amber dot appears when any alarm is present. Each entry shows the event description and timestamp. Source: `/api/stats → recentEvents`.
### Top-right: System Health Gauge
An SVG arc gauge showing the `overall_score` (0–100) from the latest health record. The colour of the gauge arc changes with the score:
| Score | Gauge colour |
| ----- | ------------ |
| ≥ 80 | Green |
| 60–79 | Blue |
| 40–59 | Orange |
| \< 40 | Red |
### Left side: UV and power metrics
| Metric | Field | Unit |
| ------------ | ------------------ | ------------------- |
| UV Intensity | `UVR_INTENSITY` | W/m² |
| Power Output | `UVR_POWER_OUTPUT` | % of rated capacity |
| Flow Rate | `SYS_FLOW_RATE` | m³/h |
### Right side: Operational context
| Metric | Field | Description |
| ----------------- | ---------------- | -------------------- |
| Operation Type | `operation_type` | BALLAST or DEBALLAST |
| Location | `location` | Current port name |
| Water Temperature | `UVR_WATER_TEMP` | °C |
### Bottom-left: Maintenance Required
Lists up to three lamps with efficiency below 75% or runtime above 2,500 hours, sorted by lowest efficiency first. This provides an at-a-glance maintenance priority list without navigating to the Predictive Maintenance tab.
### Bottom-center: System Pressure
Displays `SYS_PRESSURE` in bar.
### Bottom-right: Filter System
| Metric | Field |
| ----------------------- | ------------------------- |
| Differential pressure | `FLT_DIFF_PRESSURE` (bar) |
| Backflush cycle count | `FLT_BACKFLUSH_COUNT` |
| Backflush active status | `FLT_BACKFLUSH_ACTIVE` |
## What you can do here
* Get an immediate read on system health without navigating any menus
* Spot failing or degraded lamps instantly by scanning the diamond for red or orange circles
* Check whether UV intensity is above the IMO (252 W/m²) or USCG (530 W/m²) compliance threshold
* See recent alarms and their timestamps
* Monitor filter backflush activity which can indicate water quality issues
## Source
Data is served by `/api/stats`, which runs four parallel database queries and returns `latestTelemetry`, `latestHealth`, `recentEvents`, and `monthlyAvg` in a single response. This keeps the Overview tab to a single HTTP round-trip.